Bitcoin undervalue ,analysys using MACD
What is MACD indicator?
MACD is one of the many indicator there is to analys a chart, but I prefer MACD because it has worked so good and it also display a accurate trend following the actually chart so we can get good prediction and be able to make good trade long term and short term.
In this case the Blue line(12) when its on top of the red line(26) that when we will get into a bull run and when its red on top of blue we will most likely be in a bearish run.

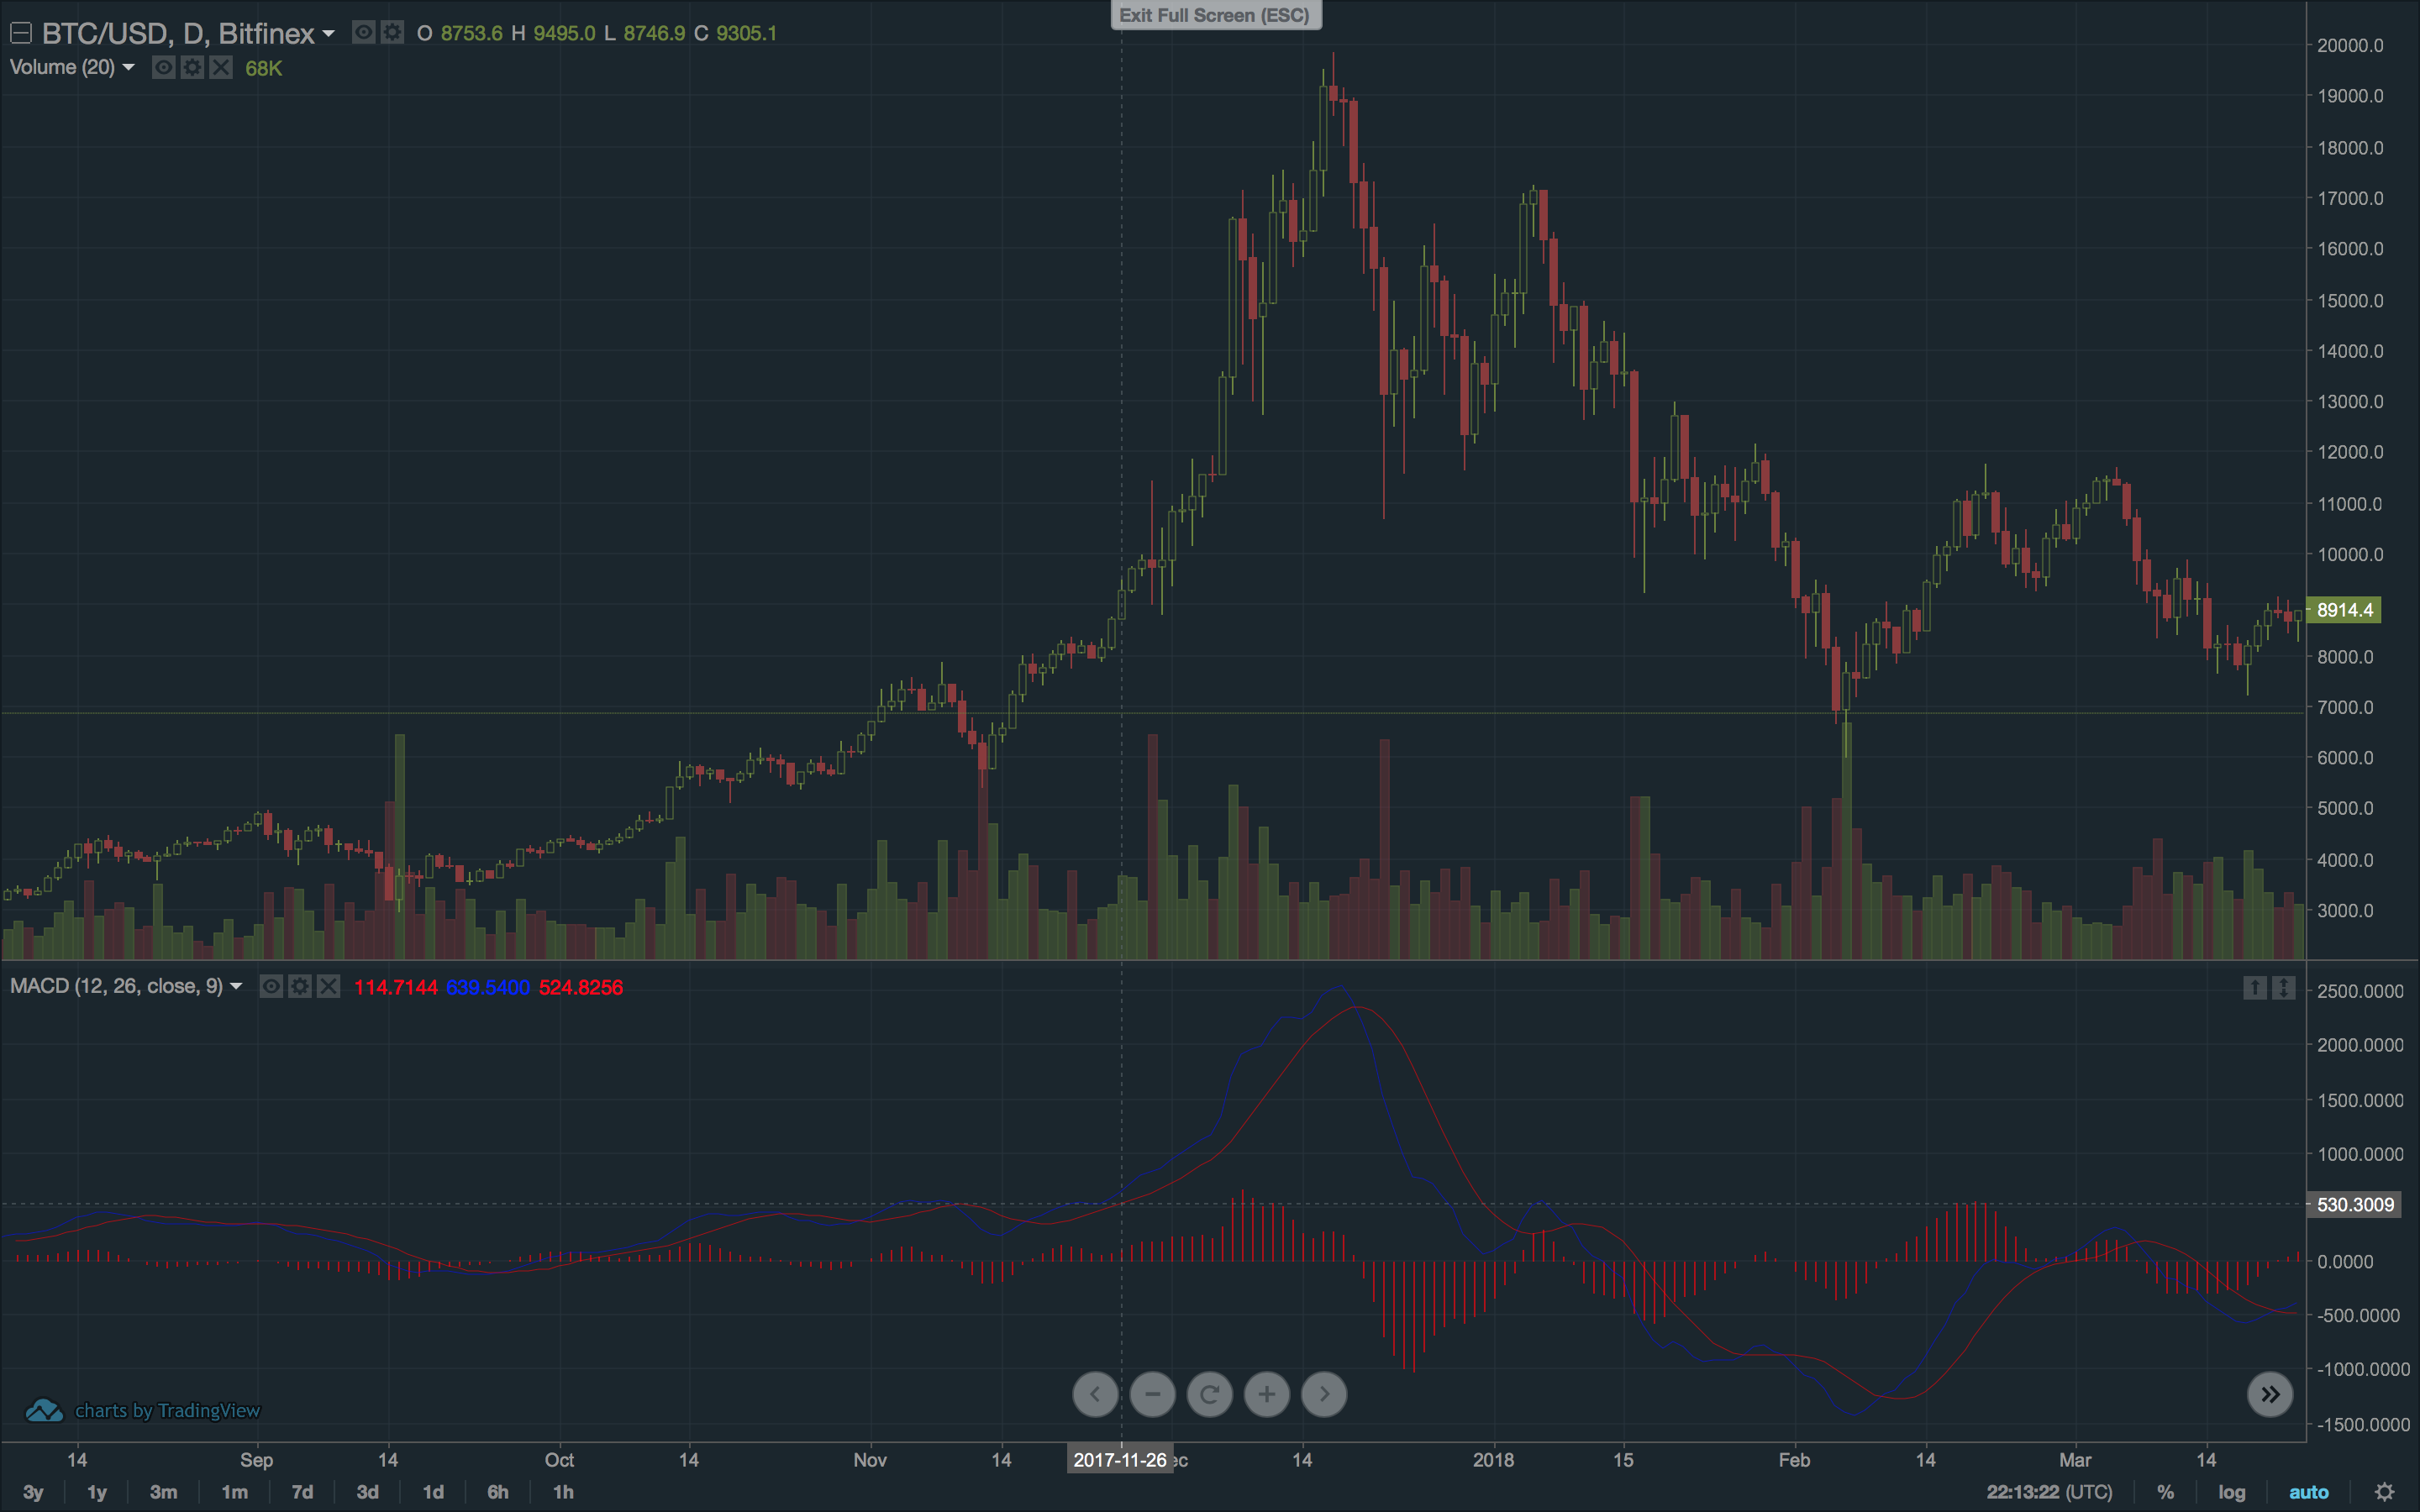
This is a BTC/USD chart with the MACD in the bottom. The Blue line is a 12 day exponential moving average and the red being the 26 day exponential moving average. Has we see in this chart and the bottom MACD we can see that its moves with the chart, it predict its next moment which won't ever be 100% accurate but like we see here its pretty accurate and reliable.

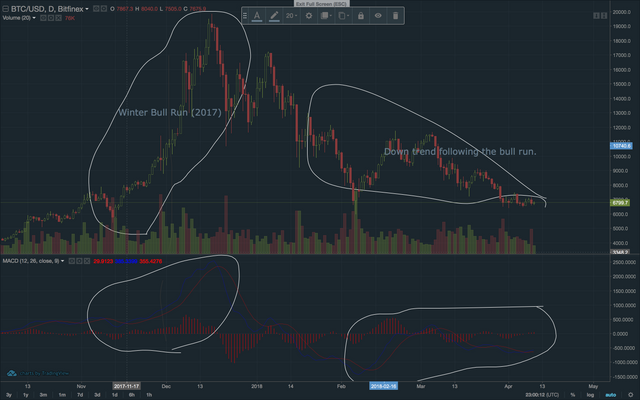
To prove that the MACD is reliable to use I showed when bitcoin made its huge bull run in November -December and the MACD follow that trend and follow the down trend that we see bitcoin in now but in this last MACD we still see that everything is below the bar in the middle, so that display that their is still growth to come.
