HOW TO READ THE CHARTS - USING COINIGY
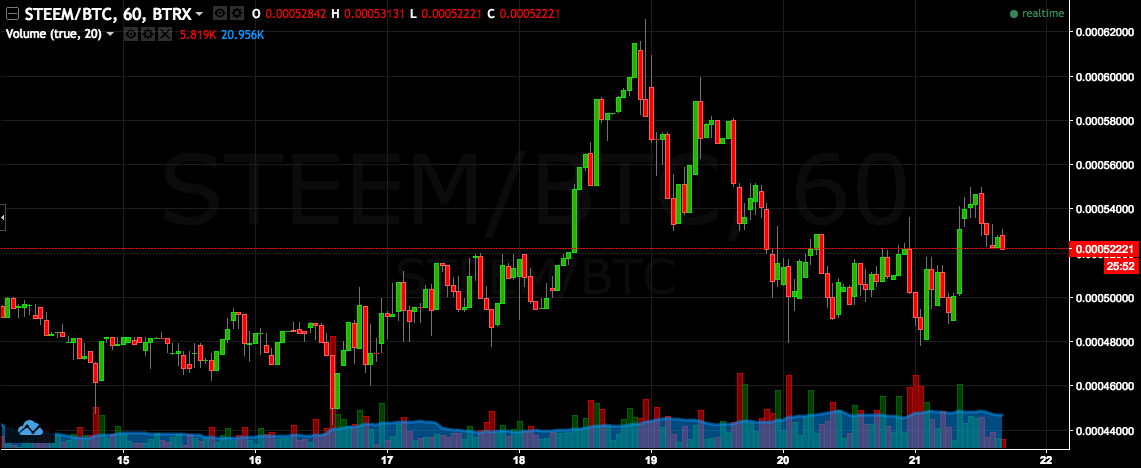
Lets take Steem as an Example over the last week :

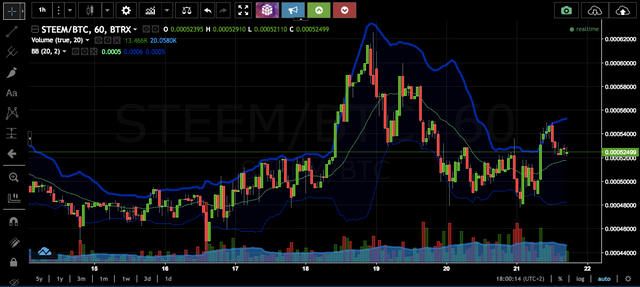
As you see Steem has a lot of ups and down. Ill show you how to really profit of this using Bollinger Bands. What this indicator does, is it shows 2 lines, 1 top and 1 bottom line. If the green candle shows a fast growth and goes beyond the Blue top line, this may indicate a dip and this way you will know its probably good to sell and buy back after the dip. The same happens when the red candle goes beyond the bottom Blue line. This indicates a big drop and this will be a good time to buy as it will go back up!
Follow these steps to set these indicators:
- Signup to Coinigy - https://www.coinigy.com/?r=4341a32c
- Go to markets and search for STEEM
Did that? Follow these Screenshots to enable this indicator

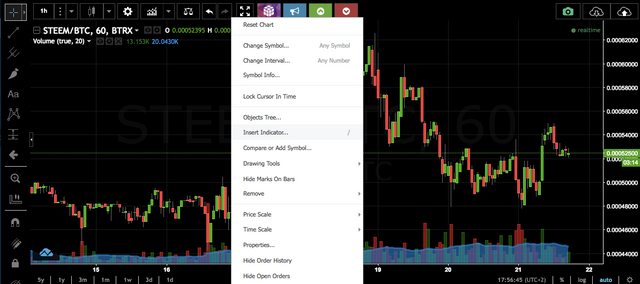
Right-Click with your mouse on the chart and choose Insert Indicator...

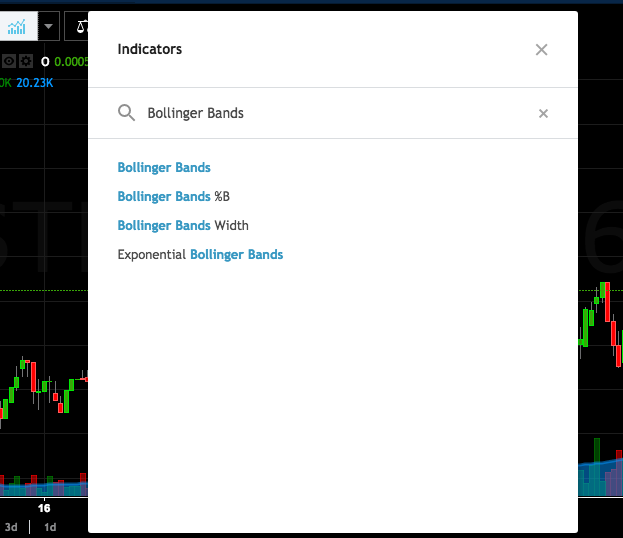
Search for Bollinger Bands and just click it...

Thats it! Read back to how to read the chart with this indicator!
I hope this helped you and have fun Trading! Good Luck!
Thanks, I've always been curious as to how this all worked. Anyhow, I'll have to check it out when I get some more time.
Congratulations @chaincoin! You have completed some achievement on Steemit and have been rewarded with new badge(s) :
Click on any badge to view your own Board of Honor on SteemitBoard.
For more information about SteemitBoard, click here
If you no longer want to receive notifications, reply to this comment with the word
STOPCongratulations @chaincoin! You have completed some achievement on Steemit and have been rewarded with new badge(s) :
Click on any badge to view your own Board of Honor on SteemitBoard.
For more information about SteemitBoard, click here
If you no longer want to receive notifications, reply to this comment with the word
STOP