Cardano (ADA) Update: A Deep Look Into Cardano “DNA” + Pivots, Resistances & Fibonacci!!

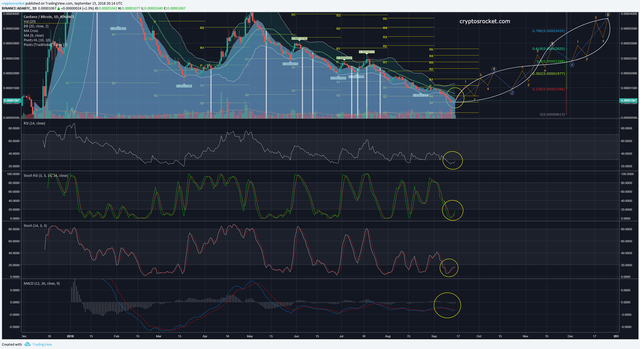
If we’re not at the bottom, we’re likely pretty close… above you can see all the pivots, resistances and the fibonacci retraction between the next support below and the highest point before the last correction started.
Overall we don’t have conflicting indicators… they are all corroborating with each other.
Let’s take a look at each indicator of our setup…
RSI – We’re already at oversold levels… a reversal should not take long.

Stochastic RSI – Again, we are at oversold levels… it looks like the scenario is good for buyers and accumulators at the moment.

Stochastic – We have a combo… oversold levels at 3 important indicators. We don’t have much margin down in the short-term.

MACD – We’re still on the downside at the histogram and the blue line has not yet crossed up, but note how it’s already at the same level as the last lowest point.

In the macro view, MACD shows us a very bullish scenario for the medium to long term… we’ll likely to start a raise soon.
Conclusion: If you’re thinking about buying ADA, you’re well on your way… wherever we look, we see a reversal trend approaching. Cardano is severely oversold and this is clear when putting all together. In the chart you can see all the past and likely next pivots, resistances, supports and also the fibonacci retracement as reference points. Stay tuned for future updates!

DISCLAIMER: None of CryptosRocket content is investment or financial advice. Please do your own research before investing and invest at your own risk. Do not invest more than you can afford to lose and consult a financial advisor if necessary.
