Market Thoughts: BTCUSD - 11/8/2019
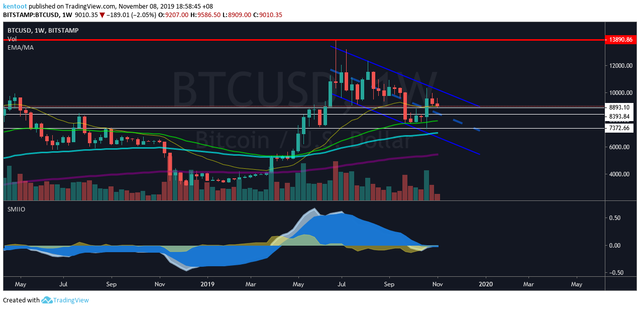
Weekly
The weekly chart appears to be holding a support on 21-ema(yellow)in confluence with a white support line that was resistance lane last may 2019.

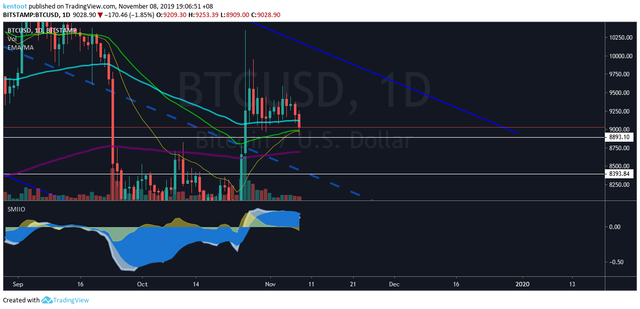
Daily
21 Day EMA and 55 Day EMA is acting as support and rejected a Dump, however SMI oscillator show there could be further dumping, support might be tested for a 1 day or 2.

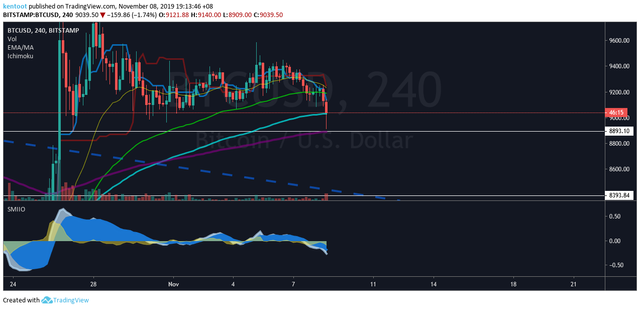
4 Hour
A ichimokou cross (Red above the blue line) signal a Dump could happen and did happened. Price have bounce from the 200 EMA to a closed just above the 100 EMA. A dump or sideways action could still continue. There is no sign of bottoming yet.

Speculation
After we bottom out, I am hoping to see we bounce and test 9800, then we could see a Descending triangle formation, which is not necessarily a bearish pattern, but a pattern the market decides were should it go.

8900-9000 arrives in support zone. If it does, it may not fall, or if it does not, it may fall to the support zone 7200-7400.