The Anatomy Of A Breakout

This weeks pattern is the breakout, a pattern that a lot of traders use to form the basis of their entire strategy. There are two main ways to trade a breakout. From a short term perspective such as trading the push that follows a breakout or using a breakout across a key resistance or support level to spot the first signs of a trend reversal.A breakout is signalled when the price breaks through a key resistance level. This is usually followed by the price spiking up within a short period of time as traders begin to realize it is possible for the price to go higher and short sellers begin to get over run. Not all breakouts are the same however we can break each different pattern down for you here today. As with every trade indicator or trade in general this isn’t 100% guaranteed however trading is about playing the percentages and the probabilities not playing the exceptions.

So what are we looking at here?
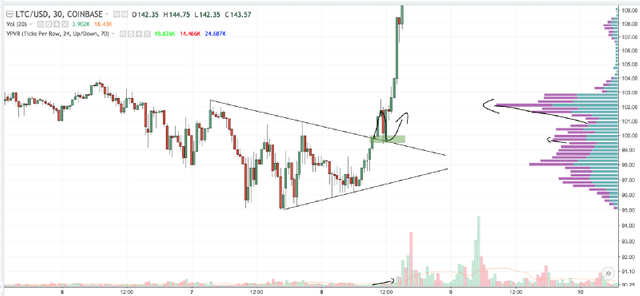
1- The buyers beat the sellers after multiple attempts of the price to be forced down. In the green box we can see how the resistance finally breaks up and the price begins to rise to new levels. We can also see (the bottom arrow on the right side volume indicator) that the volume is still really low which means that the buyers confidence has begun to increase yet they are still not convinced.2- What comes next is the final fight between bulls and bears: a retest of the old resistance, this time as support. This step doesn’t always happen however this is the best possible place to begin buying in because a stop loss can easily be used to mitigate the risk of following this trade. Bulls manage to keep the price above their old resistance level, and the bears start to get nervous.3- From here on it is over. The buy volume suddenly shoots through the roof as the FOMO sets in. A flood of buyers are now willing to pay more and sellers are removing sell orders and placing them higher, and the price moves up rapidly.These are the most common and fundamental steps to a breakout and they can evolve on any timeframe over any period of time. You can watch a fast breakout on a 15 minute chart or you can watch a breakout slowly emerge on a 1d or 1w chart over many weeks or months.
What’s Next In The Breakout Anatomy?
Usually the breakout will go as high as the high of the first wave that started the triangle (the difference from where the top black line and the bottom black line begins) before new sellers begin to take up short positions and the price movement begins to slow.
Buying A Breakout
As a buyer you have two main options when trading a breakout. Buy the point where the resistance line is broken and the price moves up. Then be patient and wait for either the price to increase or a retest of the resistance level or you can buy that retest zone. You can see on the above chart the green box has marked the buy zone for both the first and second methods however you would be buying at different times.The first method contains the highest amount of risk however that doesn’t mean it is a bad option, it just means you need to be prepared to sell if the price comes through the resistance zone. You don’t want to be a bag holder from a failed breakout. The best part is that you can easily set tight stop losseson this trade because you bought right at the bottom of the breakout.The second method is the most secure however it takes a stronger traders mind to pull this off. Alot of traders fall into the trap of waiting, waiting, not seeing any retest, waiting some more… then they FOMO buy. By now the price is already well above the breakout zone and there is no safe place to set a stop loss incase the trade goes south. It is a pure gamble and you will likely find yourself with severe losses. There will always be other breakouts… when using the second method, if the price never comes back down to test the resistance, move on to your next trade.