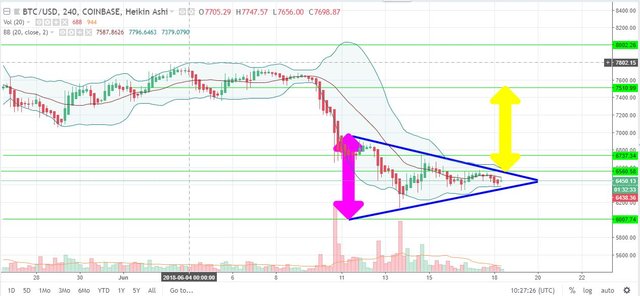
Btc forming Triangle Pattern
Hello Friends,
Here I am taking 4 hours chart and as I can see here it is forming triangle pattern and if it’s breakout $6735 then we could see Bitcoin can trading in $7500 to $7800 but if it’s breakdown then we could see Bitcoin can go down to $6030 .All matters is Volume and a massive Good News.
BTC-USD Trade Analysis by Tapash Routh
Here is the current Market Cap: $277 Billions
If Market Cap will go to $340 Billion then Market will BOOM
Disclaimer- Hello Friends this is my personal point of view so if you are looking for investment decisions. First of all try to research by your own and until then you are investing then I am not responsible for any of your benefit or losses and after reading this post you should admit and accept that

hope so it does!
following you!
Now I stop thinking about moon
bhai mne upvote kia h ap bhi kre