Bitcoin (BTC) Daily Update- Mixed Patterns, Awaiting Confirmation of an Uptrend (Charts)
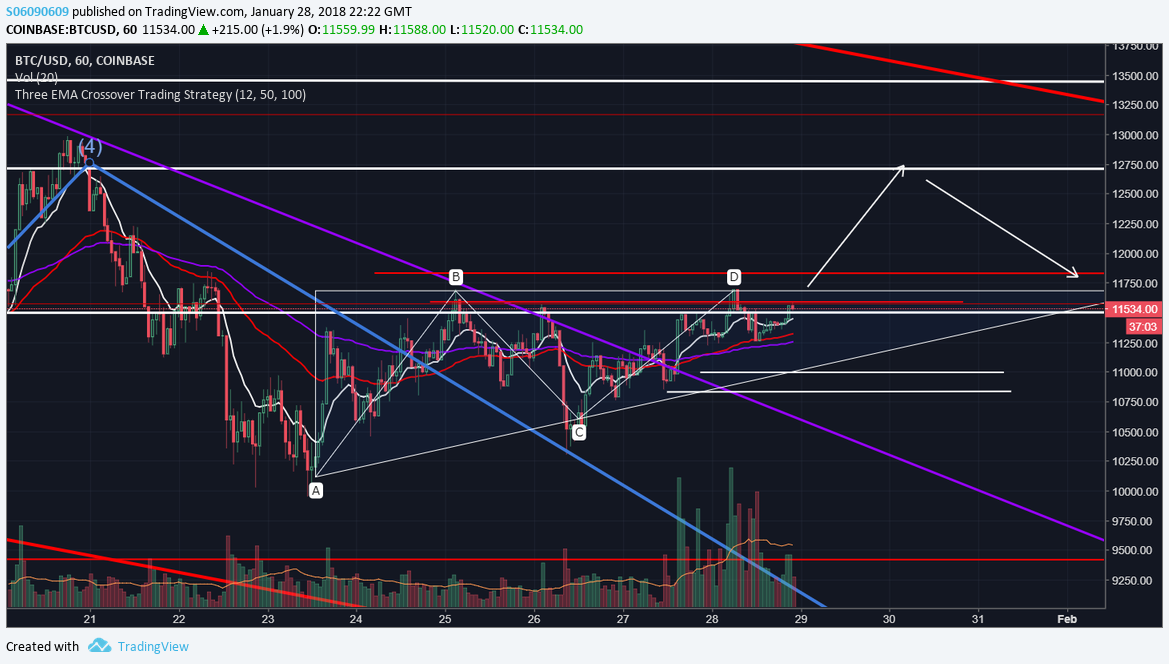
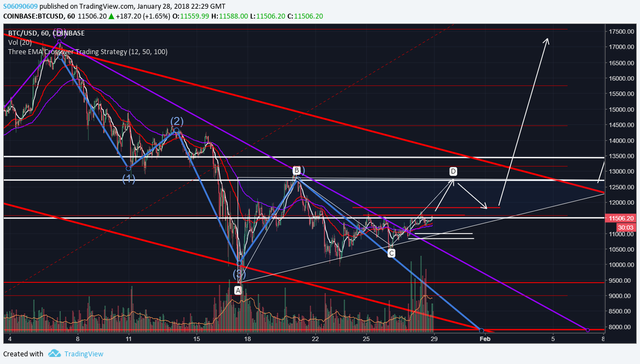
BTC price is showing mixed signs depending on what exchange you look at. If you look at coinbase/gdax, the price shaping an ascending triangle which is a bullish sign and if resistance is broken and price reaches around $13k and then a pullback, that would be a very strong bullish indicator. 
Once the price reaches around 13k, at those levels price will start to form another much much larger Ascending triangle (regardless of the exchange) which will work as a further setup for an uptrend. Because proximity between this ascending triangle and next trend line (thick red) would be so close that breakout from ascending triangle will inevitably break the trend line too, indicating a strong evidence of the end of correction.

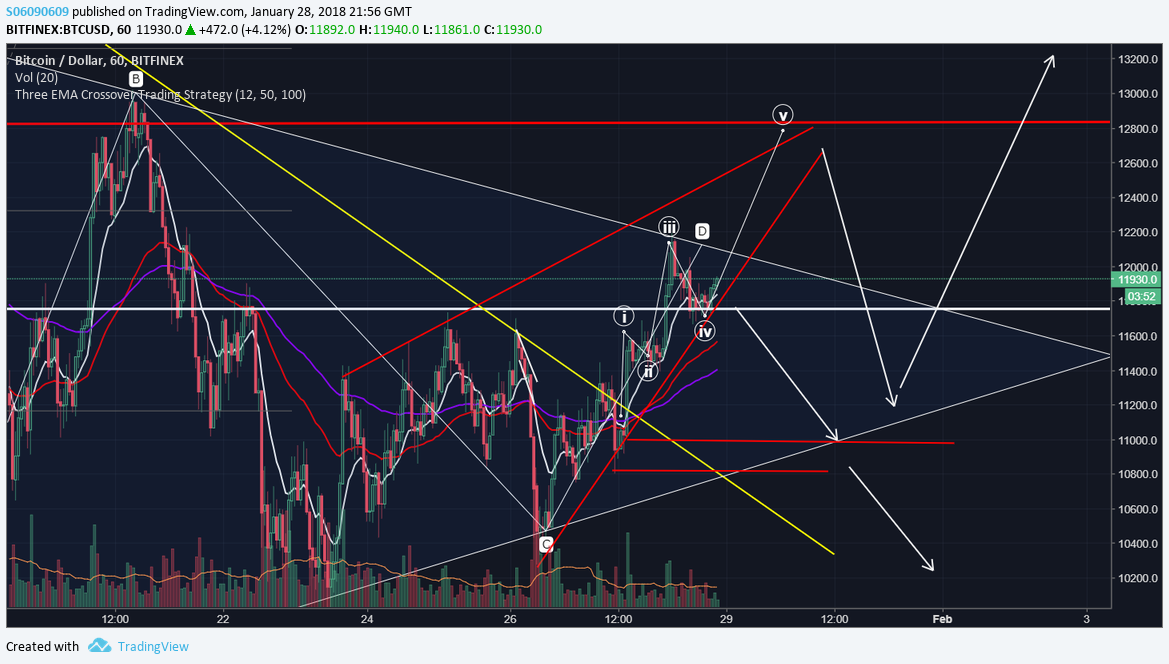
As a counterargument, on exchanges like bitfinex, the price is forming rising wedge withing a symetrical triangle that is still a part of a larger bear pennant. This means that if price falls from rising wedge and does not break out this symmetrical triangle, hence not reaching $13k zone, then on a larger scale pattern is still looking bearish.

In conclusion, if price does not breakout of this symetrical triangle and reach 13k, the trend will remain bearish, if prices reach 13k the trend becomes more bullish. Always use stop losses.
If you want me to cover any of the alts let me know in the comments.
