Weekly analysis of the price of Bitcoin - bullish BTC / USD above $ 16,000
Today we bring a technical analysis for the BTC / USD in which we see Bitcoin above $ 15,000 thousand dollars - in the last hours has had a decline of -0.72% is not entirely safe but with the news of that Visa has canceled all the Bitcoin cards issued by WaveCrest, could be one of the causes of this backward movement. We must be attentive to the direction that manifests in the BTC in the next few hours when they open the US markets.

This analysis is informative, so it is not intended to be an exact investment advice, each investor should bear in mind that investment decisions must be made based on an investigation and knowledge of the market in which they work.
Key points
The price of Bitcoin is recovering and is currently well above the level of $ 15,000 against the US dollar.
There was a break above a key bearish trend line with resistance at $ 14,100 on the 4-hour BTC / USD chart
On the downside, a bullish connection line with support is forming at $ 15,800 on the same chart.
The price of Bitcoin moves positively from $ 12,500 downwards against the US dollar. BTC / USD is currently looking for more profits as long as they exceed $ 15,800.
Bitcoin price increase
We saw a decent support base formed in Bitcoin price around the $ 12,000 level against the US dollar. The price started a good upward movement and managed to move above the resistance levels of $ 13,000 and $ 14,000. During the upward movement, the price also moved above the $ 15,000 level and the simple moving average of 100 (4 hours). In addition, there was a break above a key bearish trend line with a resistance of $ 14,100 on the 4-hour BTC / USD chart.
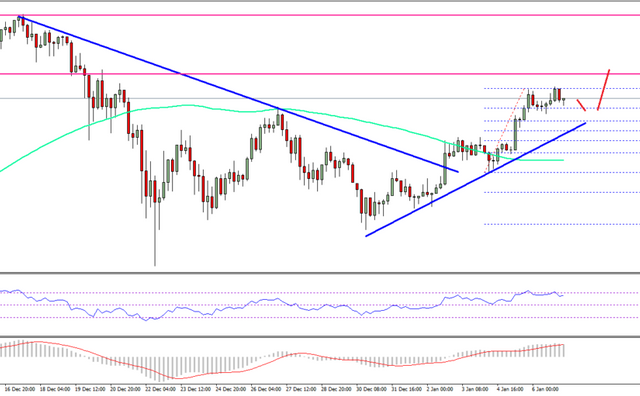 It opened the doors to obtain more profits and the price could move above the levels of $ 15,000 and $ 16,000. Recently a maximum of $ 17,048 was formed from where the price can correct a few points lower. Initial support to the downside is around the retracement level of the fibonacci 38.2% of the last wave from the minimum of $ 14,040 to $ 17,048. In addition, a connection upward trend line with support at $ 15,800 is being formed on the same chart.
The support of the trend line is close to the 50% retracement level of the fibonacci of the last wave, from the minimum of $ 14,040 to $ 17,048. Therefore, if the price is corrected lower, it is likely that you will find support above $ 15,500. The general trend is positive for BTC and the price is likely to rise further above $ 17,000.
Data of technical indicators:
MACD of 4 hours: the MACD is placed very well on the bearish slope.
4 hours RSI (relative strength index): the RSI moves more towards level 55.
Main support level: $ 15,800
Highest resistance level: $ 17,000
Upvote and Follow me if you liked reading ;)
Hey @sweetiebo, do you believe Bitcoin Cash will take over Bitcoin, like Roger Ver predicts? Bitcoin growth has seemed to slow down quite a bit recently, while Bitcoin Cash's price has skyrocketed. Bitcoin cash over taking BTC wouldn't be too far fetched.
Great post :D. Really insightful
Would be greatly appreciated if you could provide any kind of feedback on my blogs, whenever you get a chance. I just posted my first real post about cryptocurrencies and it will encourage me to keep doing better and help me on my journey. I realized Crypto is something I really love to talk about, and would love to do as well as you :D Thanks!
Regards,

@inspirationalrag
This post has received a 0.58 % upvote from @booster thanks to: @sweetiebo.