Bitcoin and the Inverse Head and Shoulders Pattern: A Strong Bullish Signal?

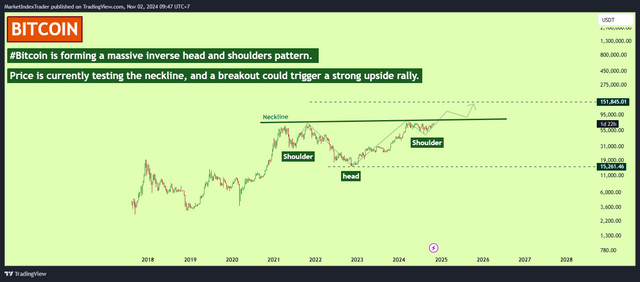
According to the technical analysis chart, Bitcoin appears to be forming a massive inverse head and shoulders pattern. This is a price pattern that often signals a trend reversal from bearish to bullish.
Key points:
Neckline: Currently situated around $95,000, acting as a significant resistance level.
Left and right shoulders: Formed in 2020 and 2024, with similar price levels.
Head: Formed in 2022, with a significantly lower price than the two shoulders.
Currently, the price of Bitcoin is testing the neckline. If the price breaks through this resistance level convincingly, we can expect a strong upward rally. A potential price target can be calculated by measuring the distance from the head to the neckline and adding it to the neckline value.