Good to see you back after a brief respite! I've got a similar H&S pattern on my daily chart, however, mine measures all the way down beneath 1000. I was also thinking that perhaps 90% might be a maximum wipeout crash from the all-time high, which might put a maximum base near the 2000k level.
I was also wondering about your W, Y, Z pattern. I was always under the impression that W, Y, Z labels were used for a wide variety of double and triple-three corrections.
The sequence below is how I always understood them to work. The example is a non-typical sideways correction, however, the basic counting premise is there.
The premise, as I understand it is that the "X" waves are intervening moves against the current double or triple three corrections...
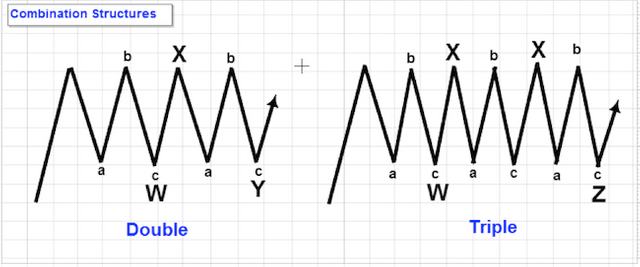
NOTE: in the "Triple" example, they left out the "Y" wave, which should have been placed under the smaller "c" wave residing between "W" and "Z."
Is this how you're getting your W, Y, Z pattern or are you using some other means by which to determine these labels? Thanks, brother!
Have you ever seen such a sideways correction like in this pic? I guess not. I haven't.
But I have seen some downward triple corrections like this. It is rare though. And there wasn't one in BTC yet.
I label it like this, because a german elliottican that I respect a lot, does it the same way.
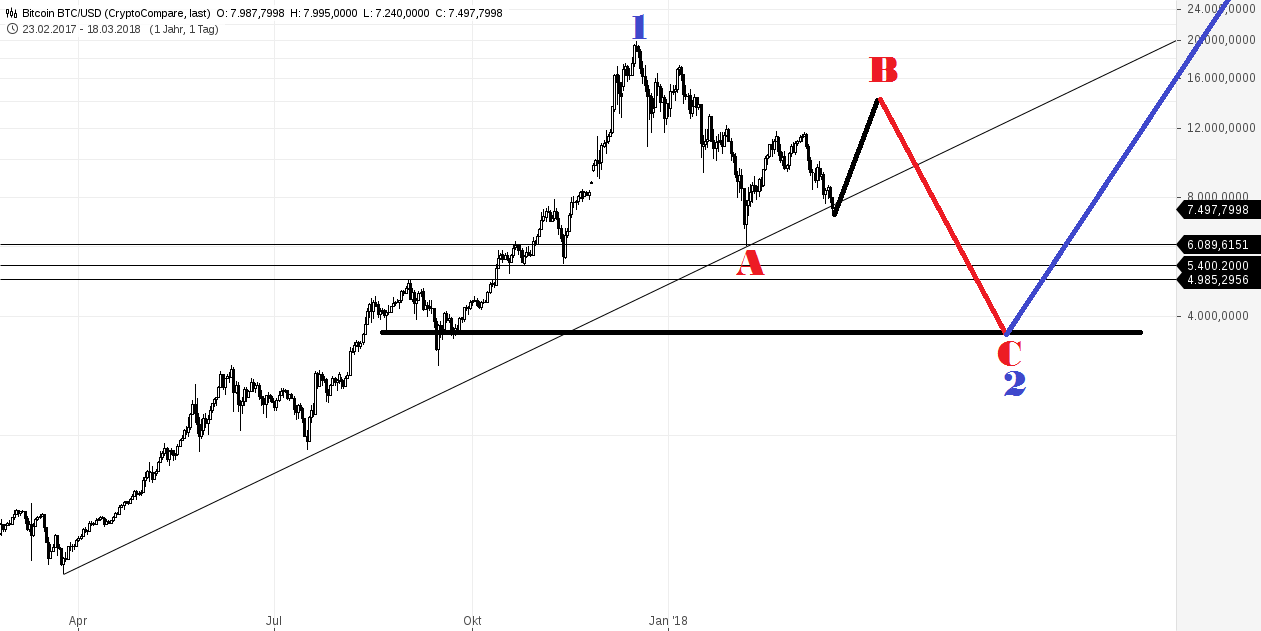
In the end it does not matter much, because my wave Y could easily be labeled as a ZigZag for wave A and thus make this whole correction ABC.
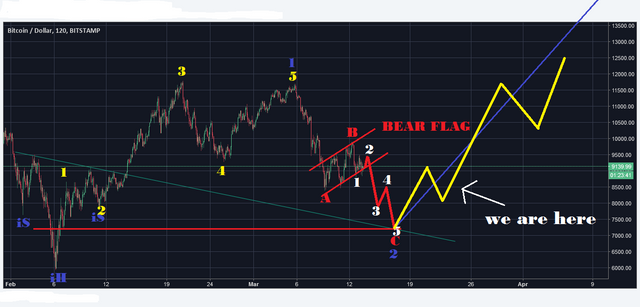
But unless there is a new low below 7300, this is still my primary count:
Yes, as I alluded too, the impossible never-ending sideways affair is for "illustration purposes" only. The various "a, b, c" moves within each intervening "x" wave can take on that of "flats," zig-zags," and even 5-wave triangles.
I hear you on the larger bearish A, B, C structure getting a similar job done, and that you're using a proprietary W, Y, X, Z count from a trusted source outside the "classic" realm of EW.
My preferred count is similar to yours in that if there is a breach beneath the recent print low of 7325.37, then my alternate (still bullish so long as the 5920 low holds) count kicks in. Comforting to know we are generally on the same page though. Thanks, man.
As an aside, perhaps you may know the answer to this - but I was scouring my old books as well as the net to see how to handle failed or truncated 5ths i.e. can they still mark a first wave at one larger degree like your preferred count shows? Logic would say yes, after all, even though it truncated/failed, it's still a fifth nonetheless. I was just hoping to find a qualified answer on that, but I couldn't. All the failed 5th examples I found were all ending moves at larger degrees of trend vs. begining moves at smaller degrees of trend. Anyway, if you can cite a source or provide an opinion I'd be grateful - because I simply don't know the answer. Thanks again, brother!
I don't know the answer for sure. But I don't see any EW rule violated. If you find a source with a definite answer let me know.
Will do, - likewise...