BTC Trading TA Journal on Binance
TA :
Weekly—It shows clearly low high at 20k, 16k, 12k and 10k. It has bottom resistant at 6k area. It shows a descending pattern. (not good for long)
Daily—it bounces at 6k support, which could be temporary bottom support. Need a daily higher low above 6,123 to confirm weekly low set, so I can expect a small weekly rally.
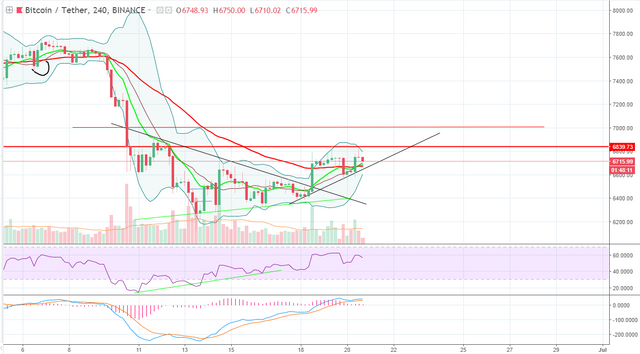
4h—it is the most important chart so far which I trade with. It early broke equilibrium and form a higher low at 6556 above 6375. MACD fast line is above slow line, which shows a little good side confirmation. However triple top around 6800 gives a little red flag.
Scenarios:
- If 4h keeps rallying and target would be next resistance level around 7,000 round number. From there then see pull-back volume to determine to get out or stay in
- Break support at 6552 and then see where it pulls back and pull back volume.
- Zoom out to daily if break daily low at 6130 but close above Bollinger upper band, and RSI forms a higher low. I would definitely try to get some BTC
- Form a higher low above 6131 change the daily trend
- Break support one at 6552 and then 6131. And then rally a little bit and keep going down. I wish it did not happen.
Plan one:
Choose Scenario 2 2):
Target: around 7k
Buy: 6680
Stop Loss: 6569
Risk-Reward: 1.86%--4.62%
Plan two:
Scernario 2 1)
Target: 6800-7000
Buy: start buy after break 6118 (if form a higher low above 6118 reanalyze again)
Stop Loss: if daily stop at low Bollinger band