Bitcoin Profits - Trading The Double Bottom Profitably
 We pore over charts to learn and to improve, as well as to track profits and losses. As ever, Bitcoin has given us a lot to work with today. Some of the indicators have been much easier to spot than others, and if you saw my update earlier, you would have seen that its prices conformed perfectly to Elliott Wave, enabling us to offer some reliable price targets and trends for the day.
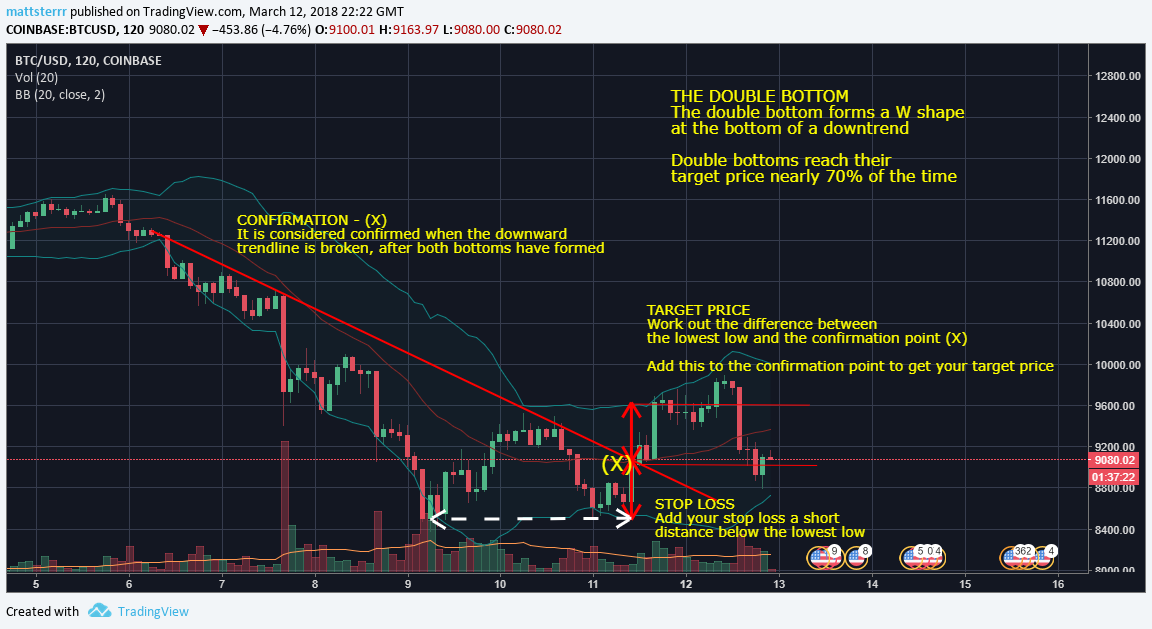
One indicator that emerged was that of the double bottom reversal indicator.
The pictures used on this page are all taken from today's BTCUSD charts.
The Double Bottom
The double bottom is a trend reversal pattern used in Technical Analysis. It comes after a downtrend and indicates that the market is soon going to reverse and there will be an ensuing uptrend.
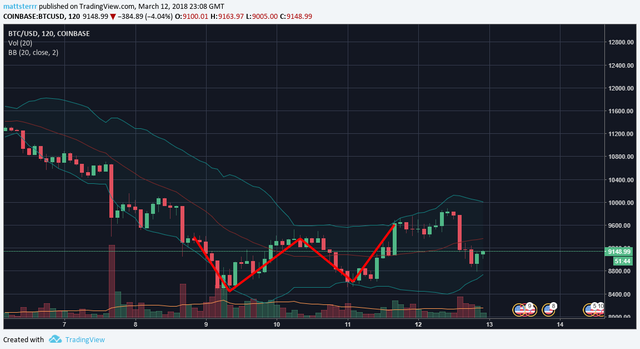
Shaped like a W at the bottom of a downtrend, the double bottom reaches its target price around 68% of the time, which makes a reliable pattern, although it is still best used in conjunction with other indicators.
This particular pattern highlights the battle between bears and bulls. The first low is formed when the bearish trend hits support. The price bounces until it hits resistance and bears seize on the opportunity and drag the price back down to test the original support. Eventually, the bulls win out and price heads back to and breaks the resistance.
Lows And Highs
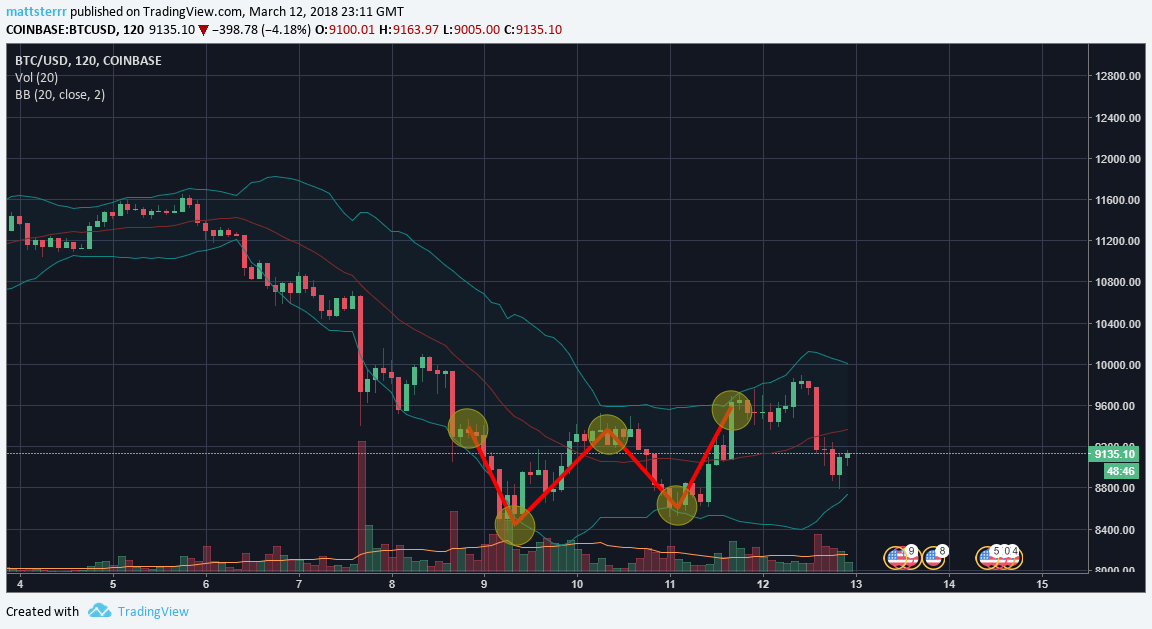
Remember that support and resistance are areas rather than strict levels. The double bottoms should be very close to the same point, but do not have to be exactly the same.
Similarly, the peaks do not have to match precisely but do need to be at a similar price.
Confirmation
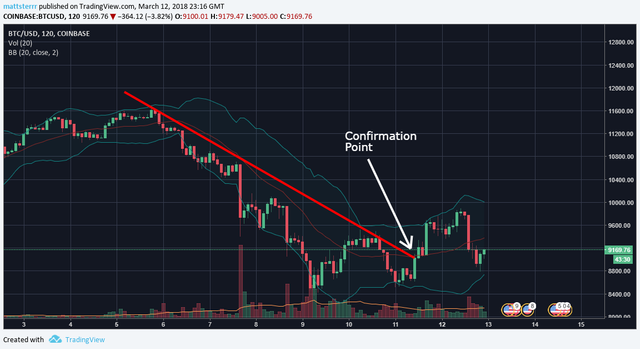
For confirmation, draw a downward trend line. Where the trend line is broken by the far bullish line, this is considered the confirmation point. The more conservative trader can enter where the neckline is broken and lower their target calculations.
Targets
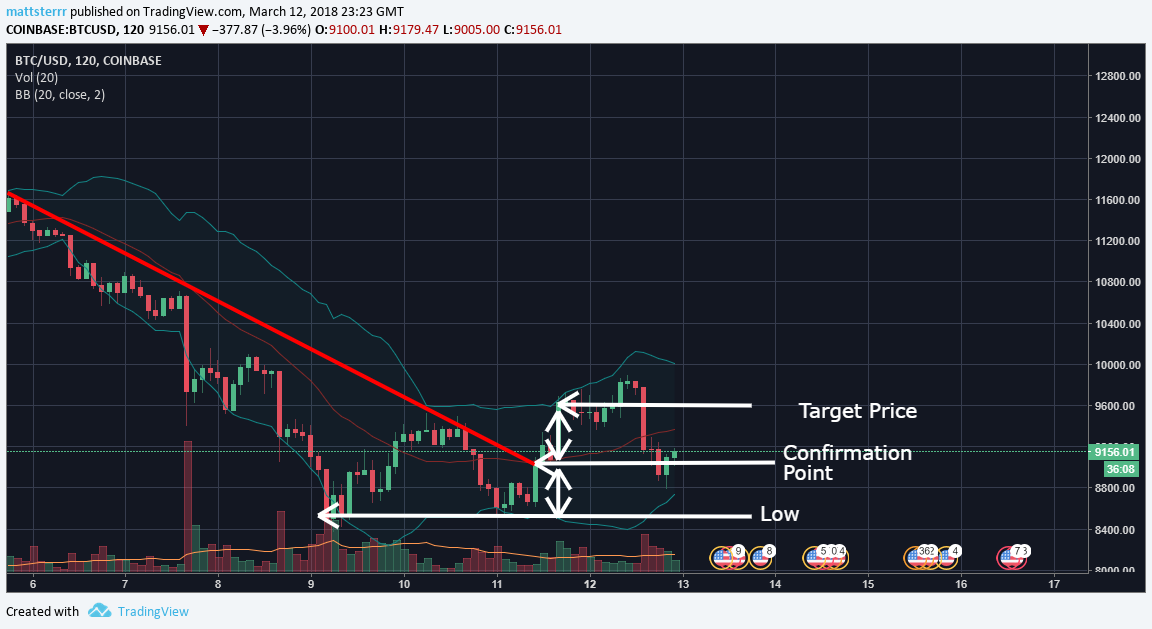
Calculate the difference in price from the confirmation point to the lowest of your lows. Add this amount to the confirmation price to get your target price. Short term traders will get out at the target price, but long term investors can hold to see whether the reversal leads to a profitable bull run.
A stop loss should be set slightly below the lowest price.
Keep this up, Followed you for more :)
Thanks - I'm trying to use current/recent crypto examples for the pieces, rather than some Amazon price chart from 1995. My posting timeframe will, to some extent, be dictated by what I find and when.
Thanks again - I'm going to go back to looking for teacups and handles for my next post!
Finally got round to posting another one, on inverse head and shoulders chart patterns this time.