Bitcoin
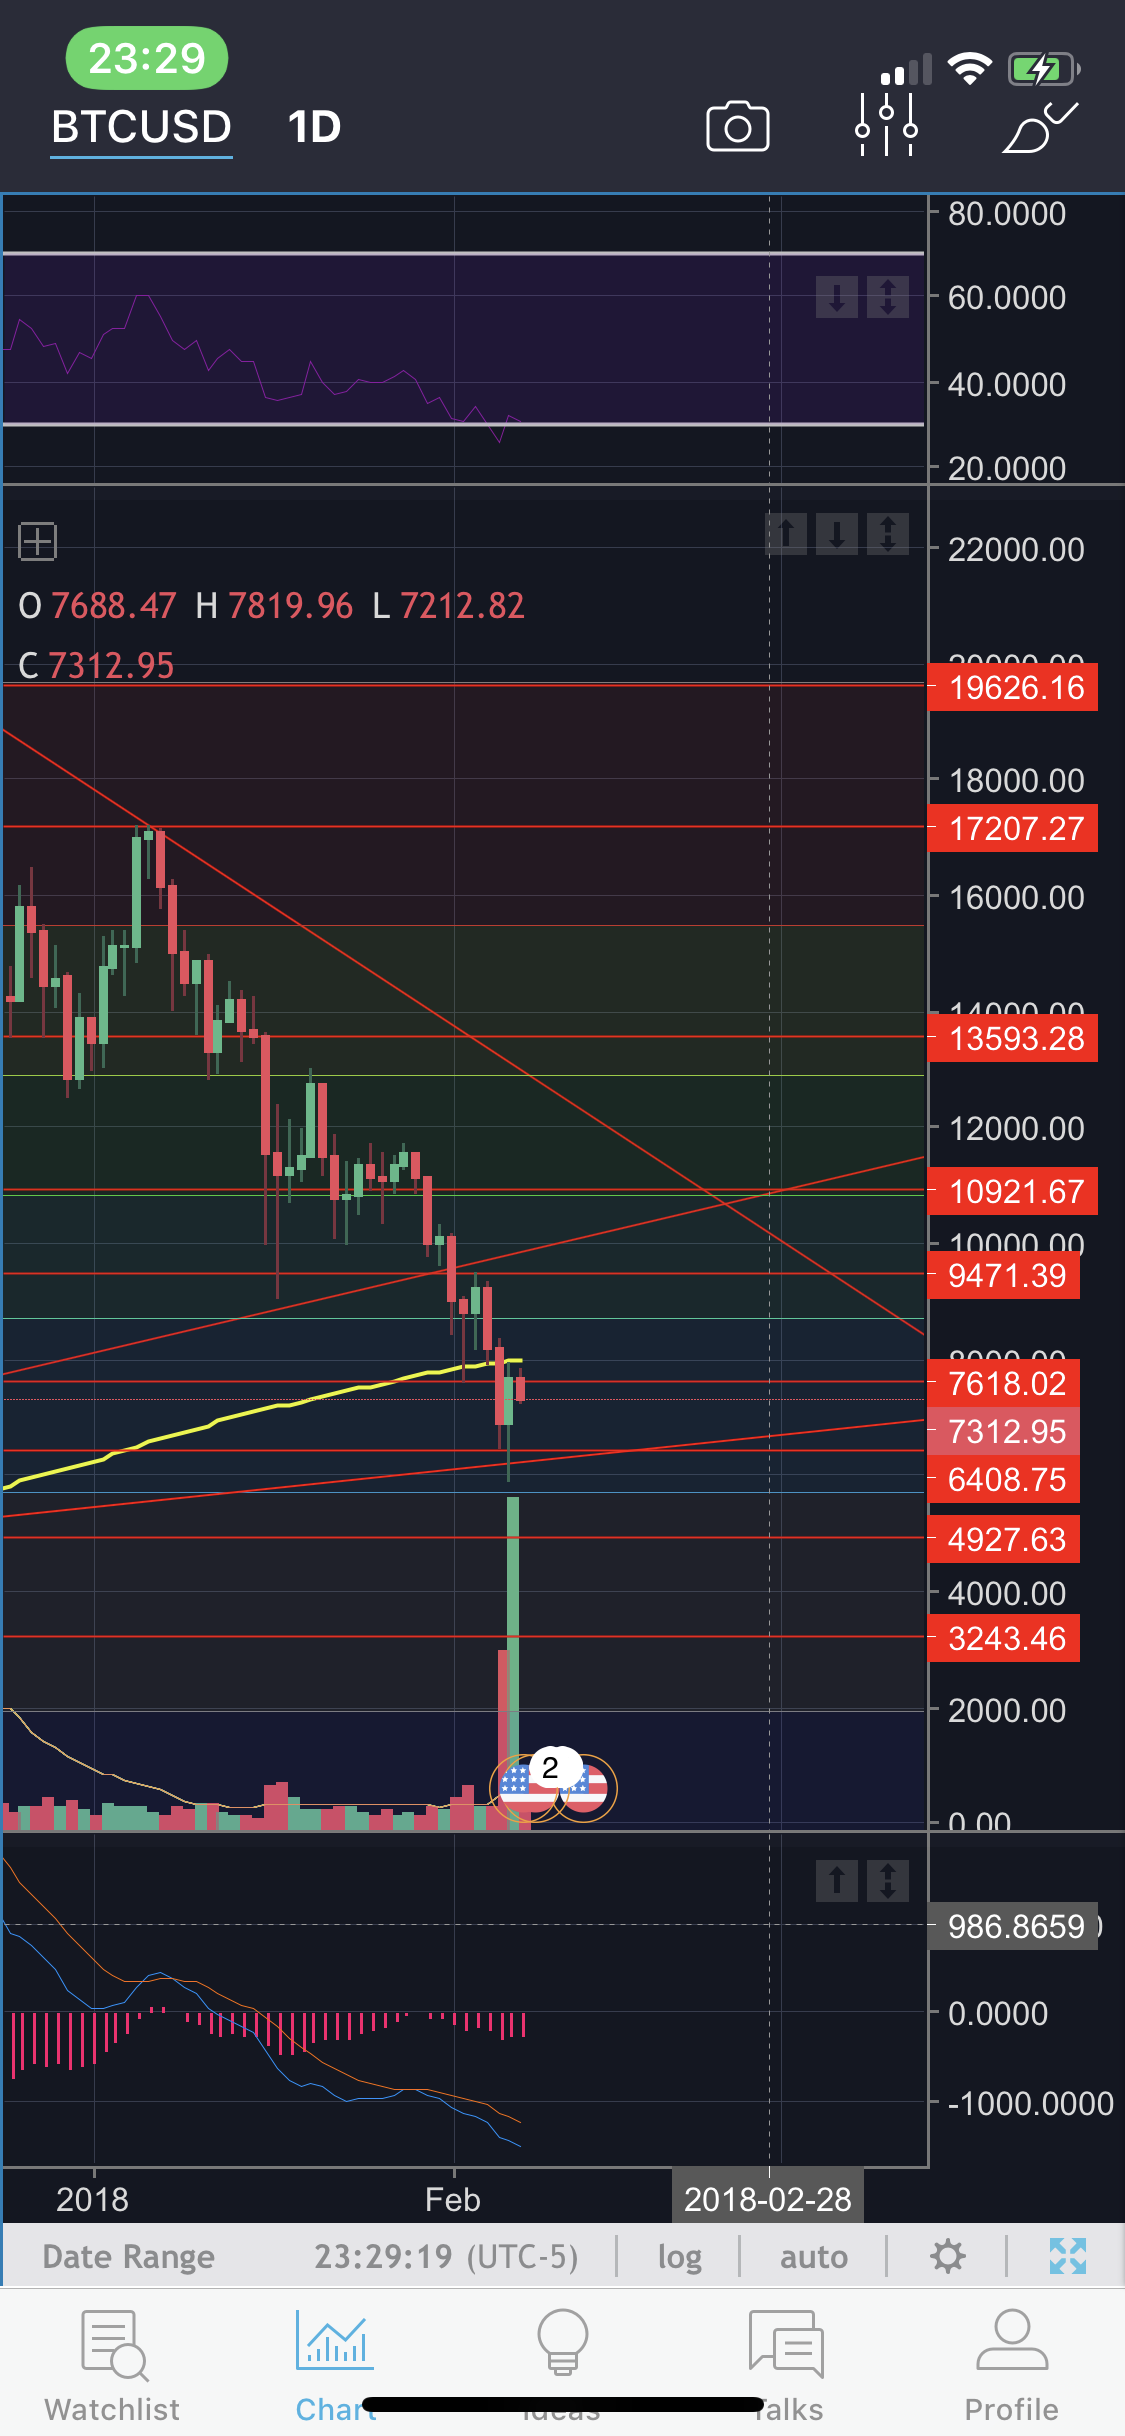
There is confusing information as to where Bitcoin is going. However the out look is temporarily bullish. Bitcoin on the daily chart Relative Strength Index is oversold and seems like it rebounded off the 5800-6408~ area. Bitcoin has been fighting to get above the 200MA(yellow line). The MACD histogram on the daily chart is diverging from the low prices. MACD histogram is moving on upwards. Towards the positive region

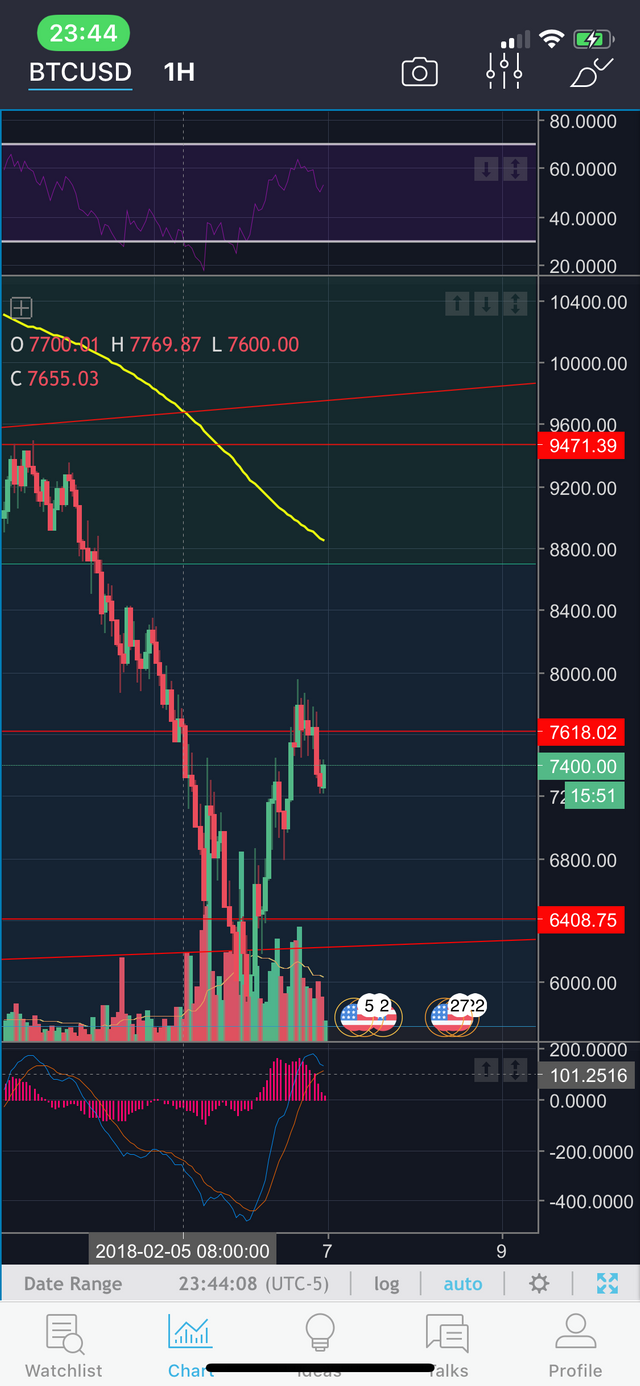
If we dial down to the 1 hour chart we see that price has been rejected at 7618~ area, but there are enough bulls to make the downwards slide minimal. The rejection from the resistance area was followed by minimal volume meaning a move that doesn't have momentum.

If we go to the 4 hour chart, we can see that the there has been an enormous amount of volume these past few days more so than the entire move down from the all time high(ATH). The MACD histogram is following price moving upwards smoothly and the RSI rebounded from the oversold area around 5800~.

The next resistance areas are 9471, and 10921. Let's see if the markets can break through them!
Disclaimer: This is my, Lee's Investment, own analysis of the CryptoCurrency chart(s). These are not to be taken as Certified Financial Advisor positions. Take these trades at your own risk. Lee's Investment, is not a certified advisory firm, and is only providing information for educational purposes. You are required to perform your own due diligence to take these trades. You should always check with your licensed financial advisor and tax advisor to determine the suitability of any investment.