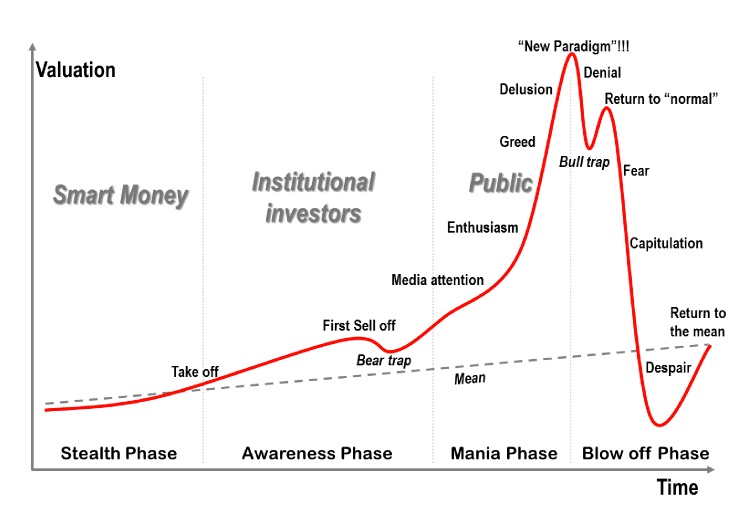
The fractal relationship between bitcoin’s first two bubbles and what they might tell us about a third

Really interesting story to read explaining the different phases of a bubble and what to expect for the next one (if there's a next one coming ...)
Story by https://medium.com/@coinscrum
I started staring at bitcoin charts just over 5 years ago.
I’d already spent years staring at all sorts of charts as a derivatives trader so I thought I’d recount to you just why I thought that first bitcoin chart I saw in September 2011 looked so interesting to me.
I liked to use Elliott Wave Theory when doing my own technical analysis — the idea that financial charts depict, as fractals, the repetition of humanity’s collective behaviour at any given scale, over any given timeframe.
The wisdom and madness of the crowd repeating over and over again.
Given that bitcoin is a curious mix of both technology and tradable asset, it’s surely worth taking a look to see if these patterns apply to bitcoin from an Elliott Wave perspective.

The notion here was that Wave i would itself potentially become the first wave of a subsequent larger (and valid) 5 wave pattern over time.
But then, as the chart below shows, the market crashed violently — ultimately giving back some 95% of its gains (with 80–90% being identified by others such as Rodrigue as typical of bubbles) when it eventually made a low some 5 months later when it touched $1.90.
This crash, however, was (again in hindsight) simply the start of a Wave ii correction (with Waves iii, iv and v possibly still to come if Elliott’s theory was to prove correct).
Interested to read more?
Take few minutes to dive in the full article
Great post
I recently red one post where it was said that after fast growth bitcoin tends to fall to previous high and then bounce and go up again.
If you are following bitcoin for 5 years correct me if i am wrong.