Could you have made money with this chart in 2007?
I did.
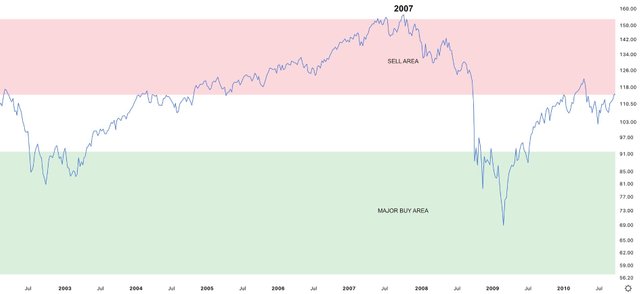
Green area = Fibonacci Buy Area
Red area = Fibonacci Sell Area
In the green area, you don't care where price is, or if it drops, you buy in stages as it goes up or down using dollar cost average. You exit the same way in the red area. No fear, no fomo, no guessing. Simple.867661a290b2481d.jpg
Sort: Trending
Loading...