You are viewing a single comment's thread from:
RE: BTC big pic update 17.04.18
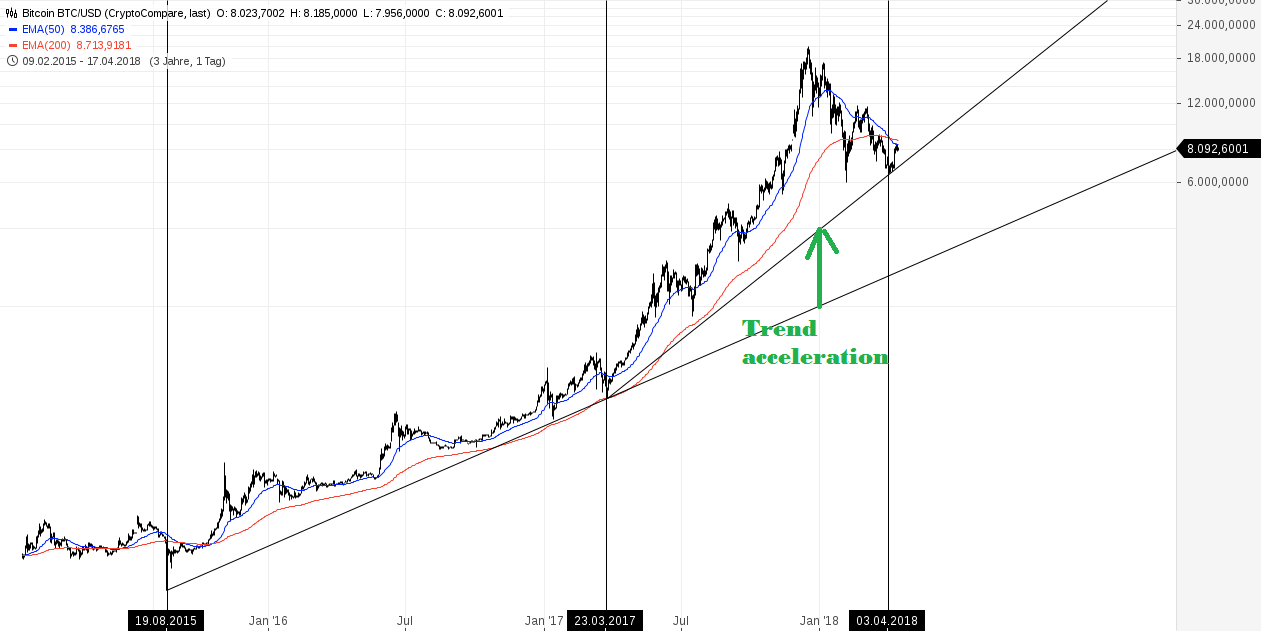
Concerning the coordinates/dates of this trendline have a look at this:
.png)
If we see 5 waves up to the level of black wave 3 (instead of 5waves up for black 1, 3waves down for black 2 and 5waves up for black 3, that would be a huge warning sign for a trend reversal.
It is a bit difficult to explain. I will draw it when the time has come.
This trendline and 6500$ are the things to keep an eye on for now.
I think I get the idea - if we overshoot that is a sign for being unsustainable.
Thanks for the big picture - Just being curious. I thought a trend line need three touch points to be considered relevant. How is your view on that?
Yes. If a trendline has 3 touch points, like the lower one, the market considers it valid. The acceleration trendline does not have three touch points yet. If wave 2 bounces off of it like I expect, then good. For now it is only a hypothetical line where I expect to find some support.