BTC update 20.01.18
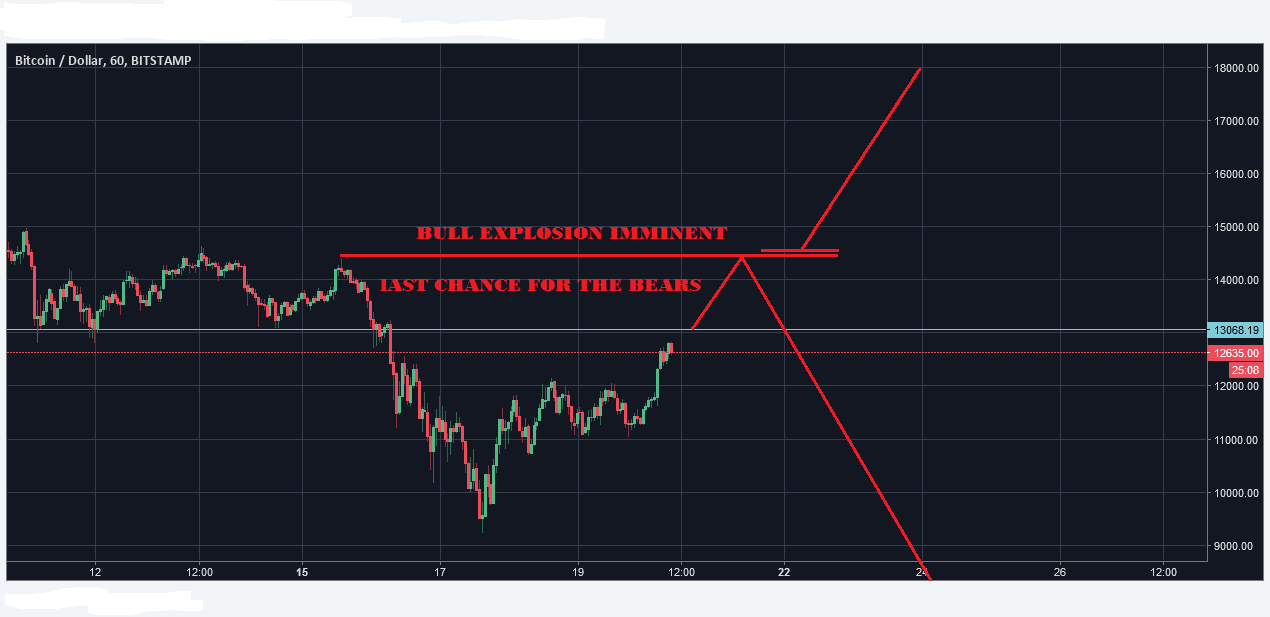
This is the last chance for the bears.
In my opinion they already lost, because the overall altcoin market looks extremely bullish already, which I will show you in my next posts after this one.


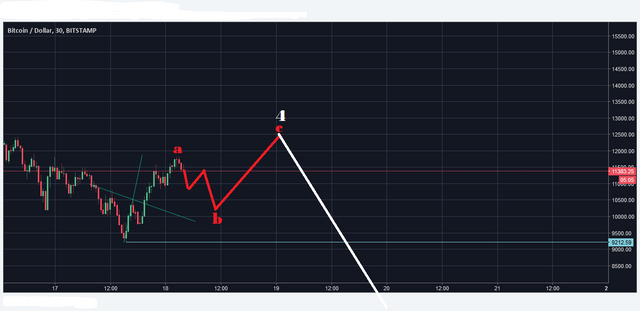
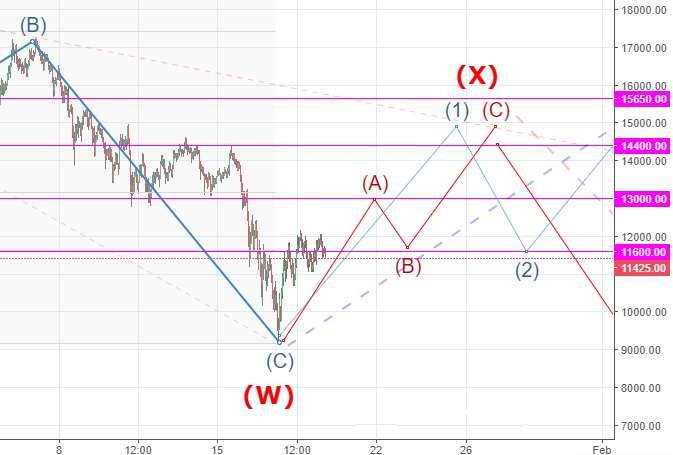
The pattern in BTC does not look bearish, the shape is more of a wave 2 than of a wave b. The price action indicates weak bears.
The bears need to turn this around very soon, or they will have to watch it climb to 28,000$...
.png)
If you think this to be useful information:

.png)
Feel free to use and share my charts, but please mention me, @ew-and-patterns as the author. Otherwise it is considered plagiarism and I will flag you and advise my friends to do the same.
.png)
MUST READ!
DISCLAIMER: This post / analysis serves general information purposes only. I am not, and never will be a financial adviser. The material in this post does not constitute any trading advice whatsoever. This is just the way I see the charts and what my trading ideas (from my personal experiences) are. I use chart pattern and Elliott Wave analysis for my trading ideas.
For full disclosure: The author of this post is holding positions in this market at the time of this post. Please conduct your own due diligence, if you plan to copy anyones investment decisions!
If you make any trades or investments after reading this post, it is completely in your own responsibility. I am not responsible for any of your losses. By reading this post you acknowledge and accept to never hold me accountable for any of your losses.
Please consider leaving a comment, like or resteem, if this post entertained you or helped you see things differently...
Have a nice day :-)
Great as always. Keep it up!
I hope the good days are back again!!!
Agree with you, @ew-and-patterns! Thank you for the regular updates on prices!

Here is my idea regarding the topic:
I also stand for $14 400 as a turning point, there also can be a bounce on $13 000
Good luck in trading!
Not to be a pessimist, however, I don’t know if reading charts can tell you what a coin is going to do. I think if a coin holds value to an individual they will buy it. Funny thing is when a coin tanks hard everyone sells and it really tanks!
Great photo
The breakout above $12,000 was a fantastic sign for the bulls. Now we just have to break the longer term down trend, and make a higher high! Looking mighty bullish!
Actually no. Real breakout is 13500-14k and holding it. Trust me June-July correction was very similar had a lot of turns looked like it was gonna go up but then boom failed hard. So real turnaround is 13500-14k that is a true break out downward point channel on a daily chart. Pull up the daily chart and have a look. Its pretty evident.
Good blog ..
I am really appreciate to see this post ...
Carry on. best of luck dear 😊
I am waiting steem predition
:)
Very helpful informations for btc lovers.