BTC evening update 01.02.18
Wow... Today I expected a calm, boring day, but the opposite happened. I don't remember the last time being so wrong in my morning forecast. But it happens... No pattern works 100% of the time, because if it would, a market would be impossible. A few people would own all the money in this market within months.
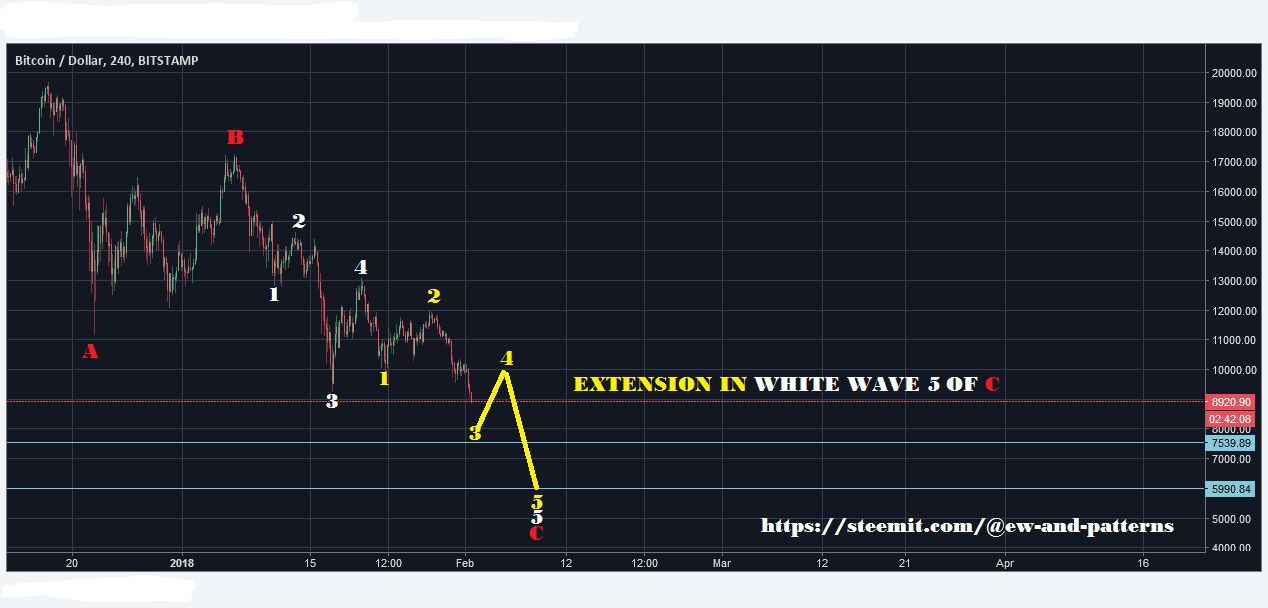
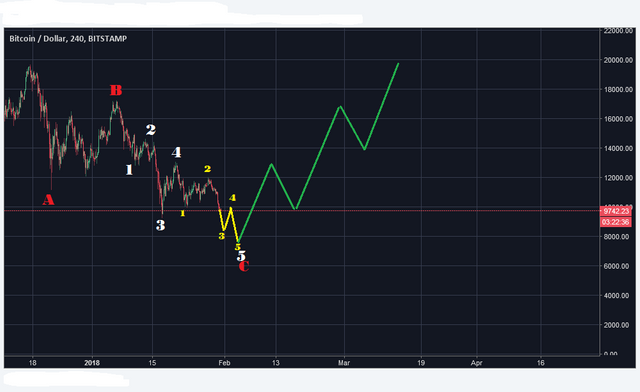
My primary count was invalidated today, so the alternate count which I presented yesterday is now what I assume to be correct.


If you are interested in Elliot Wave counting, read on. If not, the post is over for you.
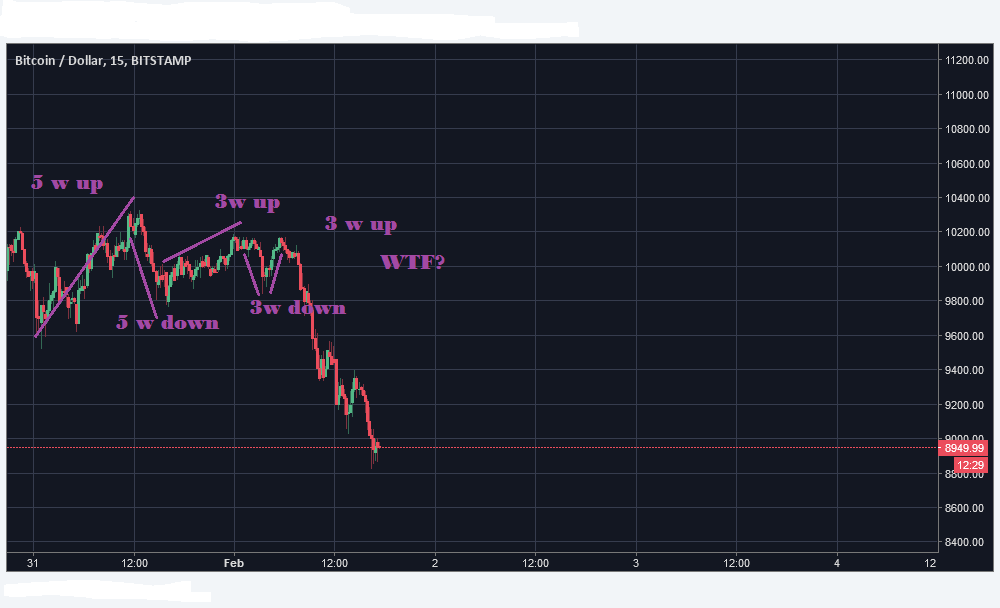
Take a look at this wavestructure. I don't see a clear way of counting this mess.

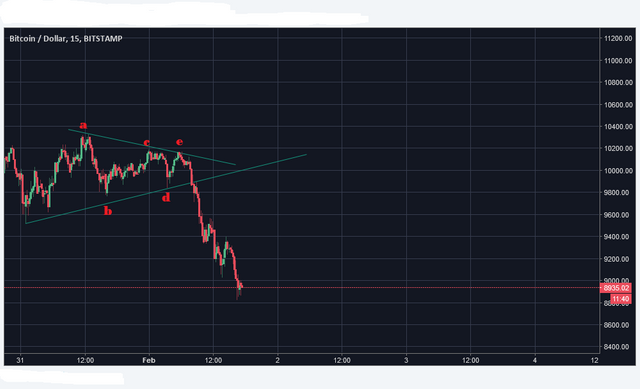
The best thing I could come up with is a triangle. But the waves of such a triangle are expected to be 3-3-3-3-3 and not 5-5-3-3-3.

If you have another suggestion for counting this specific correction, feel free to share.
.png)
If you think this to be useful information:

.png)
Feel free to use and share my charts, but please mention me, @ew-and-patterns as the author. Otherwise it is considered plagiarism and I will flag you and advise my friends to do the same.
.png)
MUST READ!
DISCLAIMER: This post / analysis serves general information purposes only. I am not, and never will be a financial adviser. The material in this post does not constitute any trading advice whatsoever. This is just the way I see the charts and what my trading ideas (from my personal experiences) are. I use chart pattern and Elliott Wave analysis for my trading ideas.
For full disclosure: The author of this post is holding positions in this market at the time of this post. Please conduct your own due diligence, if you plan to copy anyones investment decisions!
If you make any trades or investments after reading this post, it is completely in your own responsibility. I am not responsible for any of your losses. By reading this post you acknowledge and accept to never hold me accountable for any of your losses.
Please consider leaving a comment, like or resteem, if this post entertained you or helped you see things differently...
Have a nice day :-)
hi @ew-and-patterns . When do you buy in? is it already the right moment you think? And what alts you gonna buy? upvoted!
Going to buy altcoins @ 7500$,6000$ and 4800$ BTC. Risk on when there is FUD.
Not sure yet what to buy, but I have an eye on RDD, TRX, XRP and SPREAD for high risk/reward.
Great explanations. Here's my take, I think we're in a big ABC correction. Would love to hear your thoughts on my prediction:
IMPORTANT COIN UPDATES - BTC, XVG, TRON — Steemit https://steemit.com/bitcoin/@benkalashnikov/important-coin-updates-btc-xvg-tron
Your wave 3 labelling is 100% incorrect, because of only 3 waves. But you know that it does not really matter much, because it is not about the impulse waves, but about the correction.
Yes I think it is an ABC as well. This ema could work as a short term support, but I doubt that it will end the downtrend instantly.
The 1-hour Bitfinex charts show big potential support @ $8800-8870. That was the low from November 30, 2017!
Here's my take, and it has been unchanged and so far correct since 10 days - it's frivolous to just use Elliott Waves in a situation like this, I haven't even bothered to adapt the ABCDE.
The lowest wave is missing out one it seems, and now we're having a small bounce... not for long.
Because.
It has been clear since awhile that we have a bear market with lots of new and fearful investors, and we can only break out once certain requirements have been met - most importantly, institutions are waiting to buy at below 8k, they have been stating this for months but nobody listened... so the FUD keeps coming and nobody wants to buy.
Look at the momentary triangle (dotted lines, the upper one corresponds with the 2/1 blue line of the Gann Fan), and where they meet the Fibonacci golden pocket, it happens to be at the $8000 resistance line.
Institutional investors cannot overlook this, and they will be using it - they may be pushing further down to 7600 or even 6000, but not for long, no reason to be afraid of that at all - it will be 'healthy' but all the guys who have their stop losses below 8000 will be forced to sell, as institutions will need much volume to buy... never trade against them.
Once they are done with this sorry business, they will want to see the market go up again of course...so the way I see it, the faster Bitcoin drops a bit below 8k, the better.
There's a trillion dollars on the sidelines waiting for btc to dip below 8k. I predict the fastest growing market cap ever seen.
Great stuff! You're not the only one unable to make sense of this. We had the hangman on Dec 17th. Now if you look at the daily we are at the end of the fifth ABC today and we eclipsed that long red wig from Jan 17th. So we should be on our way to the old high of 8300 sometime in the next few hours. Now if I interpret your analysis correctly, it's analogue to my own, we should be doing the next impulse move up when we bounce of that low at or around 8300-8500 having completed 5 ABC corrections. That impulse would be the first third up with a wave up and then down mid Feb taking us over and below the 13888 that Cliff High has in his data.
I just don't see your primary count in the daily much less the 3 day or weekly. If I look at the Fibonacci numbers we should continue to go down hard in the next few hours and then hit that bottom wherever that might be and do the impulse up straight from the bounce.
The weird thing is and here I agree completely is that the chart as is doesn't make sense in the absence of market manipulation. After that hangman on Dec 17 we actually had a quite extended correction lasting 31 days and then had what I thought was an inverted hammer at the end of the week on Jan 26th BUT then we continued to go down making this a super long 40ish days correction. The waves today cannot be put in 3 or 5 sequence.
This only makes sense if someone with a lot of BTC is moving the market with targeted sell orders to drive the price down. In any case we are at the end of 5 and should be doing the first part of the 3rd up from here.
I'm no professional just sharing my view on this. Appreciate your analysis and sharing it here! Steem on!
Oh and I do think a few people own all the coins/money in this market. They're the smart money and big BTC holders and they will always be in every market no matter how far from the PTB you may think it lies, but that's just my two cents.
As they say, "sometimes, (sh)it doesn't have to make sense".
We're on the same boat, and your ABCDE triangle is the pattern I came up with and was relying to. So I was not betrayed today and am happy with what's going on.
Except for BTS. I don't get why the f* it won't go down. This one pisses me off a little bit I must admit...!
By the way, upvoted as always, I appreciate your work so much.
Bts is a community coin here and it's not much known out there... quite impressive, it's behaving like ETH and Stellar Lumens, the latter being highly interesting too because it didn't remotely suffer as much as Ripple did... very resilient, good to know once we climb again. Always learn from the hard times ;)
Yeah, we're heading straight for 8000... seems all the rats are jumping overboard, I cant believe there were people still expecting this to go up again these last few days.
But they shouldn't sell now, never a good time in a free fall - now it's time to hodle even if it should touch 6 k, which I don't really expect.
Hold their breath for a few days and think about something else till it's over.
What a drop. I think we are near the end, in price, maybe not in time. But think of all the new users signing up at exchanges and the new apps announcing crypto adoption on a daily basis. When we see an upturn there are literally millions more people able to buy in! That’s got to be healthy.
Thank for sharing information @ew-end-petterns
Yes bro this post is very useful .so resteemed.
Good blog ..
I am really appreciate to see this post ...
Carry on. best of luck dear.. .
😊😊😊