BTC Update: 2-19-18
Price: ~$10,400
24HR:
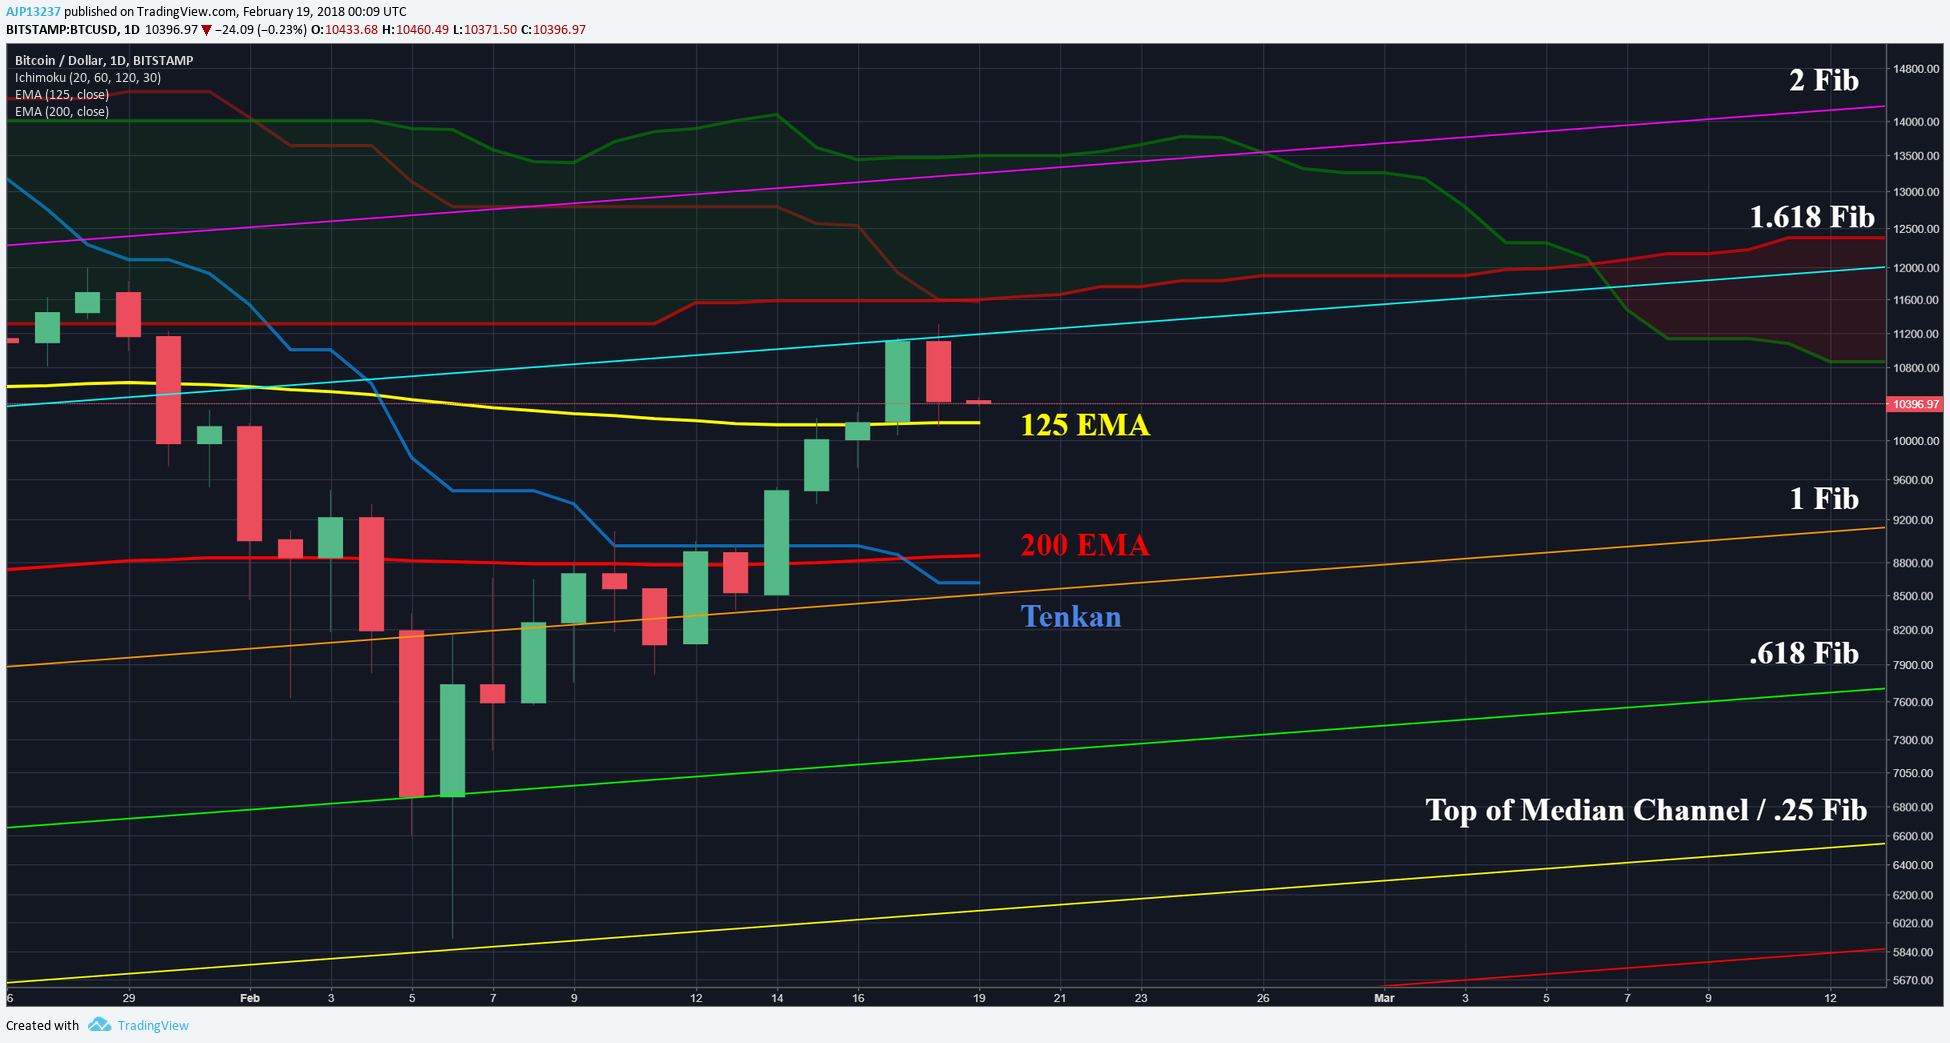
After breaking through the 200 EMA, BTC contiuned to surge through 125 EMA & to the 1.618 fib. The 1.618 fib has begun to be resistance & price needed a pullback retest to the 125 EMA. For the time being these can be considered a consolidation zone ($10.2-11.2K) until price breaks strongly in either direction.
In the event that Bulls continue to surge and break past the 1.618 fib, the bottom of the daily cloud hoevers around $11.6K and will likely be hard resistance to break through, requiring a few attempts to complete. In the event that Bears regain their footing the 125 EMA will likely break & the next strong support is not until the confluence area of 200 EMA, Daily Tenkan, & 1 Fib in the $8.5-9.2K region.
12HR:
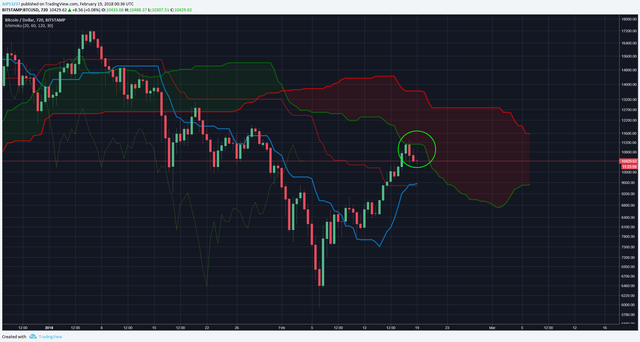
In previous updates I’ve talked about the 12HR cloud cover looming ahead of price in the not too distant future. The future has arrived & BTC’s first encounter with the cloud has been an unpleasant welcoming, however at the very least the TK’s have begun to cross. If price continues to have trouble getting into the cloud, the TK’s will be tested for support.
2HR:
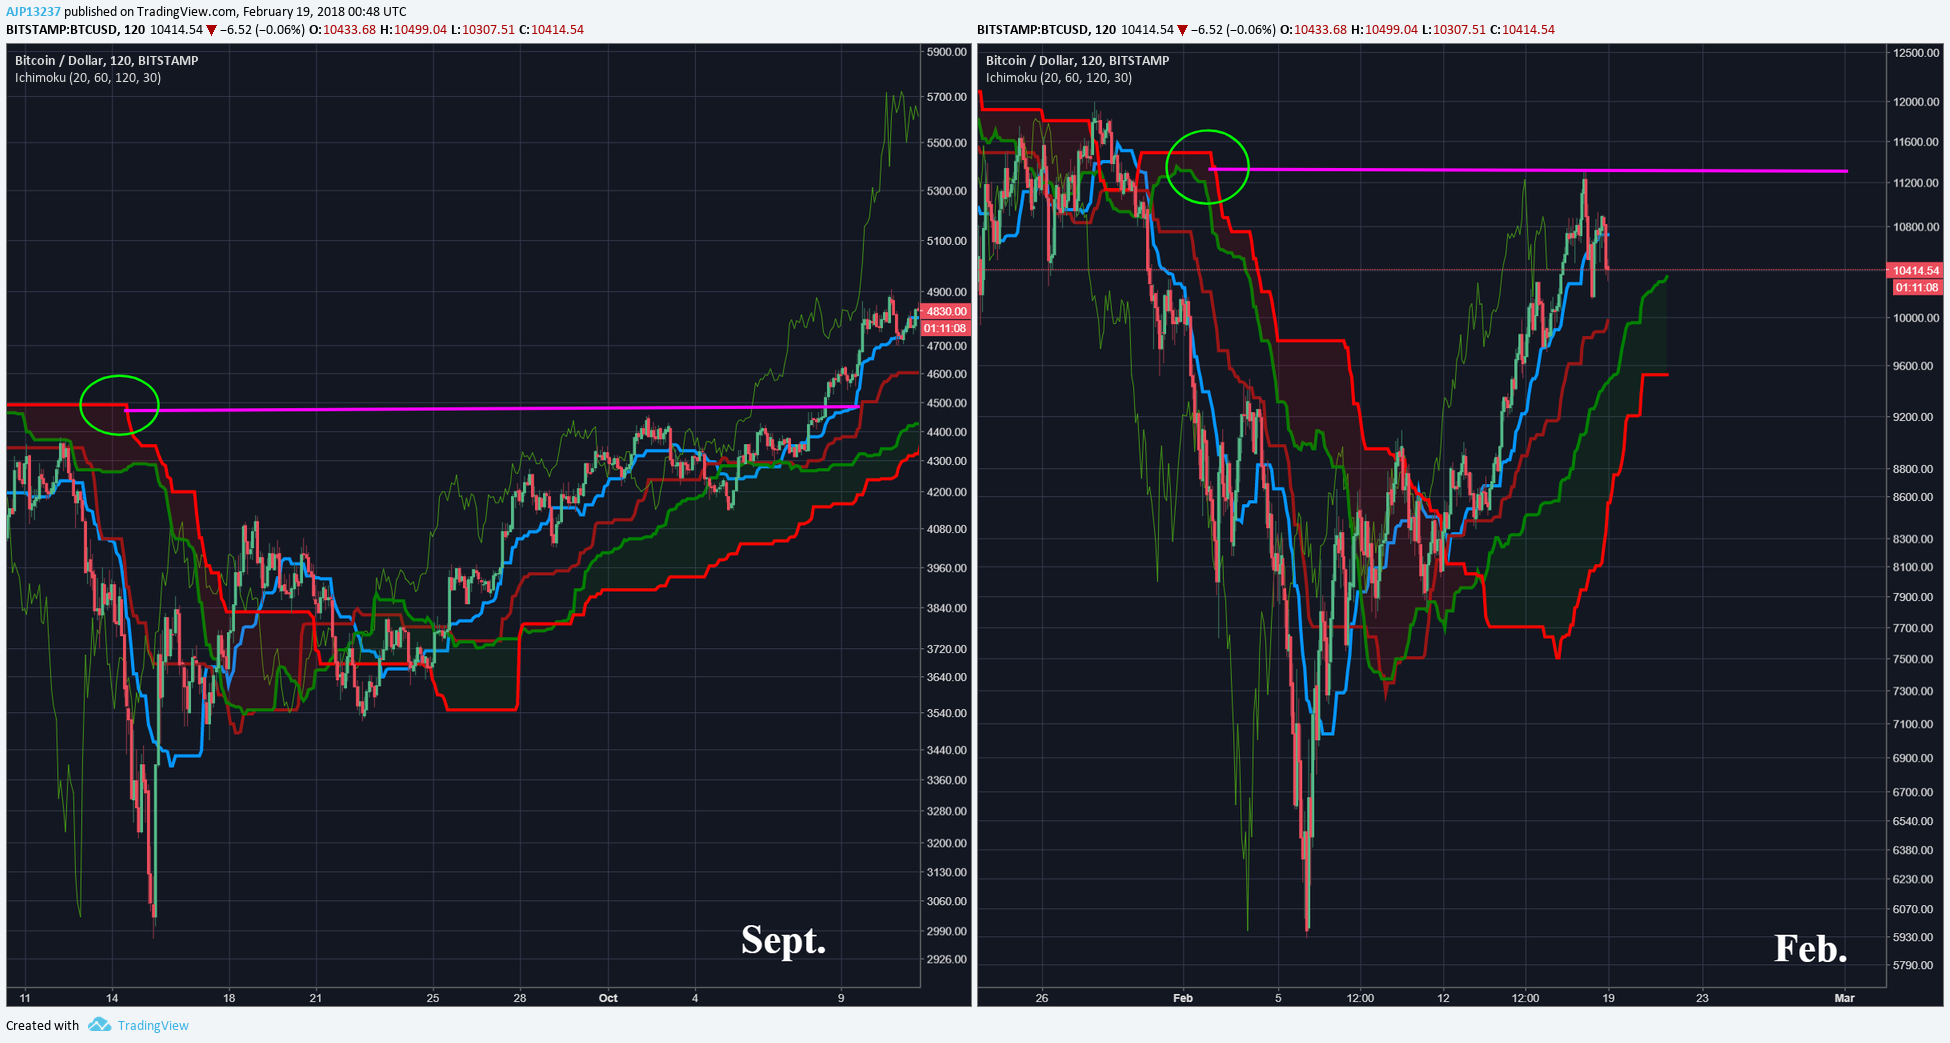
Below is not so much commentary on price action, but more explaining how the cloud works & a short trade setup I recently played. Notice in the green circle, what I call “Cloud Cliffs”, cloud cliffs are sharp drops in the cloud created by the price action preceding it, followed by an extreme valley. When price begins to make its way back up these cloud cliffs usually offer strong horizontal resistance (purple) and intuitively it makes sense, price was extremely rejected before at this level for a reason. At these cloud cliffs, it is not a bad idea to setup a short in advance with a tight stop limit and a moving stop limit down.
Weekly Cloud:
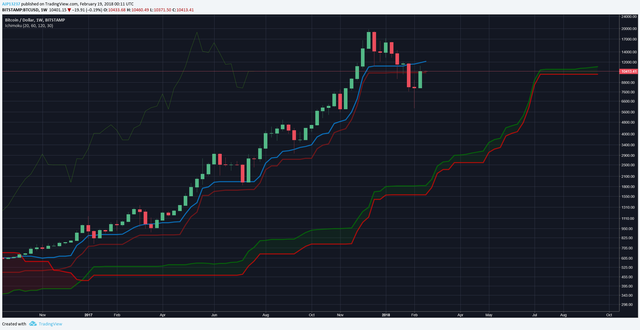
On the weekly cloud, BTC pulled itself back to the Kijun and closed just above, a good sign for bulls. However, it is too early to be determined if the Kujun is truly support & likely will need plenty retesting in this region before cleanly breaking up.
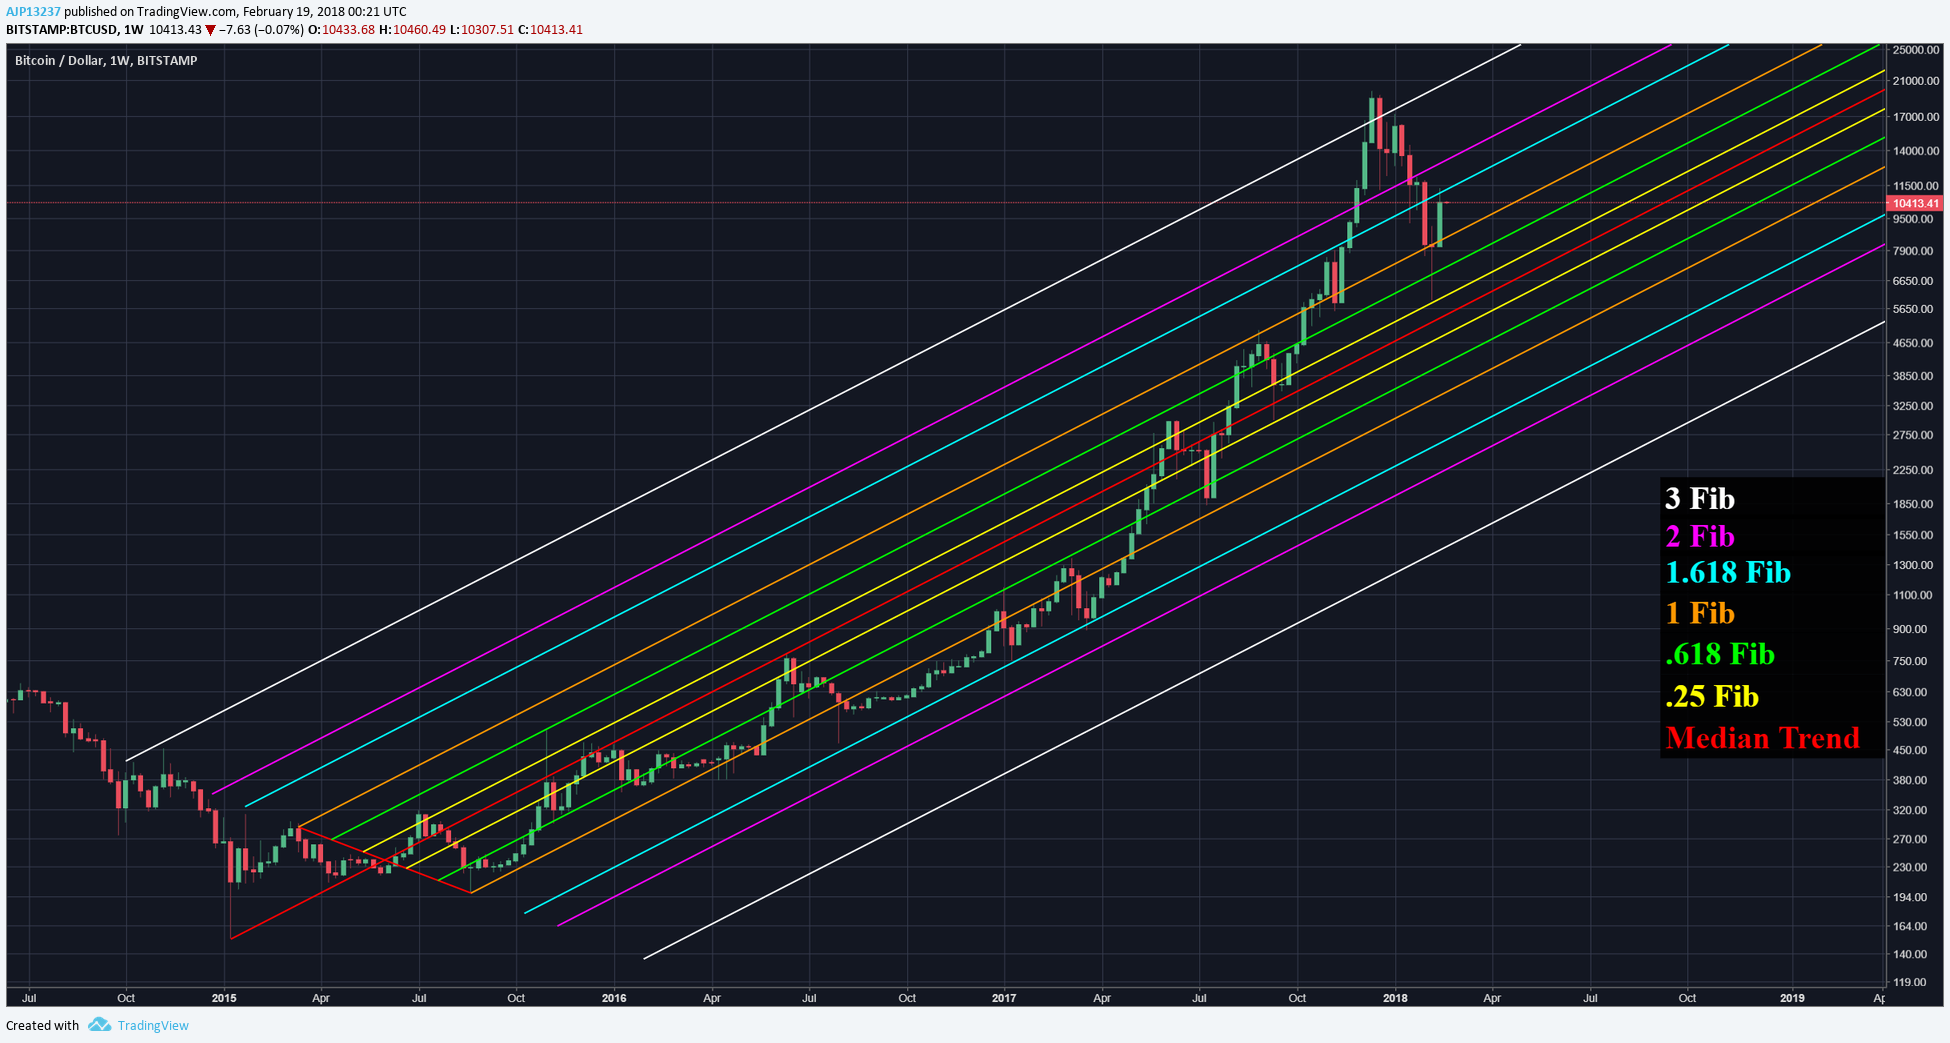
Weekly Pitchfork:
The top of the median channel / .25 fib has held as support, creating a strong bounce over the 1 fib & just below the 1.618 fib. Consolidating in this region & retesting the 1 fib are likely in the mix before more up.
EMA Follow-up:
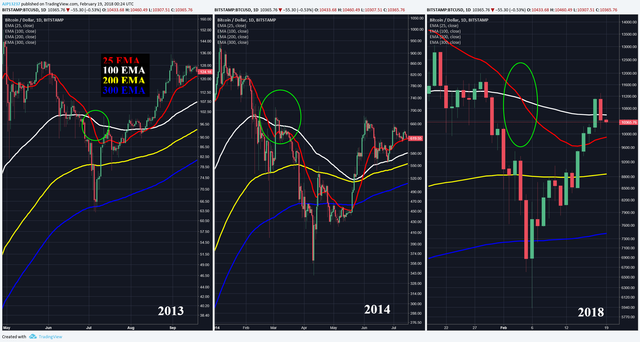
In previous update I had talked about the 25 EMA & 100 EMA crossing. At the time I had said:
“At the moment, the 25 EMA looks like it’s beginning to flatten around current price levels, possibly an indicator of an extended consolidation zone. I believe it’s too early to draw conclusions, but another thing I will be monitoring in the weeks ahead.”
Given that the 25 EMA is not only begun to flatten, but also begin to turn up is a good sign for bulls and possibly starting to resemble more of 2013, than 2014, still too early to say. However, can also see that price has difficulty at the 100 EMA again & likely continue to have difficulty crossing this zone until the 25 EMA re-crosses as well. Another thing to be on the lookout for in coming weeks.
Prognosis:
BTC has been surging since the $6K bottom, however is beginning to encounter resistance in the high $10’s & low $11K’s. Many indicators point to this area being a strong resistance zone & likely consolidation battle between bulls & bears for an extended period. In the event that Bulls falter, there is resembling support around $8.5-9.2K region. In the event that Bulls continue to surge there will be more resistance waiting for them in the $11.5-12K region.
If you found this useful & educational, please like, share, & follow.
steemit: @ dogevader
twitter: @ Noob_Charts
Finally, if you have any questions or comments, leave them below & happy trading!