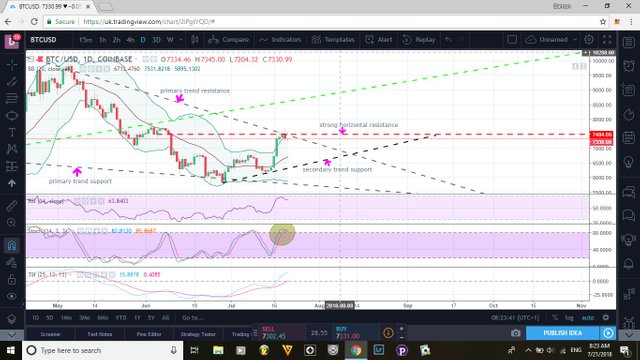
Btc/usd coinbase daily chart forecast.

Not financial advice and please do your own research. This post is my thoughts on a scenario that may or may not play out.
Btc was rejected on 20th from the confluence of the primary trend resistance and also resistance from the strong horizontal support of $7500 area.
I am expecting a pull back in price now over the next few days possibly to $7100 - $6850 area which would also meet with the 0.5 fib and middle Bollinger band MA. Also the stochastic on the daily chart is turning around to give a sell signal and has historically brought the price down a peg or two although the stochastic hasn't actually completed its u-turn as yet (21/7/18)
Longer term im keeping an eye on the primary trend resistance and secondary trend support which if both hold then they are forming a symmetrical triangle which should continue the secondary trend upwards.
Beyond this symmetrical triangle, if secondary support holds, it is forming an ascending triangle which should hopefully give btc a boost above current horizontal resistance and on to the next.
If neither of the above holds and it stays under the primary resistance then it stays in the falling wedge pattern that its been forming since April/May. This may bring one more low but when breakout happens it could bring highs not seen since April/May by late August.
This is the daily chart so its not going to happen over night.
Let me know what you think in the comments and thanks for reading. If you like it then dont forget to upvote.
I followed you and up vote. please followback @huanmv