Good analysis
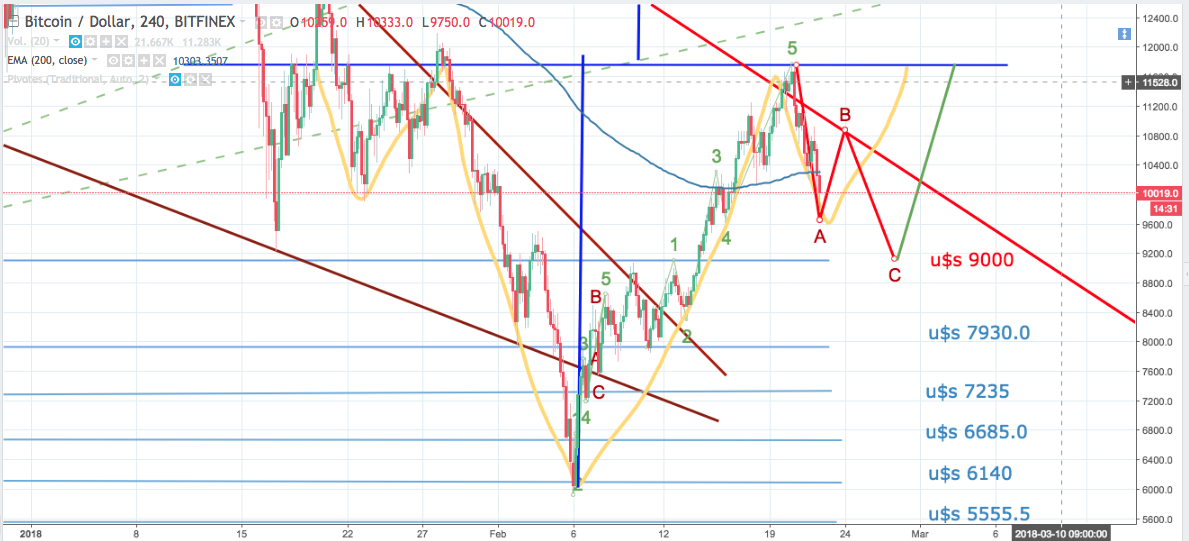
I share analysis and counting in the graph
I see the bearish wave 1 could rebound at point B of the graph that is a bearish trend line, a bearish wave 2 that could reach 9000 dollars, if accompanied by the volume
to then raise and form the right shoulder of the head shoulder inverted figure.
Around 9,000 dollars there is a good previous support or it could bounce before.
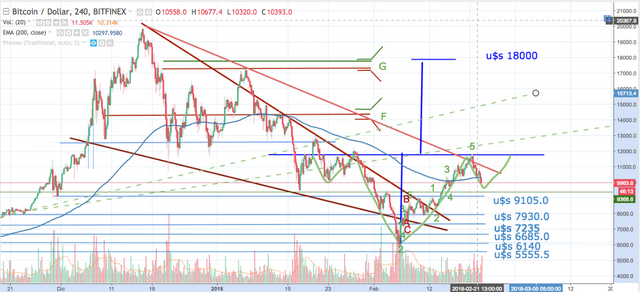
With a subsequent rise confirm figure.
Target $ 18,000.
I await your comment, thanks