Bitcoin – October 29 to November 5, 2023 Neural Network Modeling
Bitcoin – October 29 to November 5, 2023 Neural Network Modeling
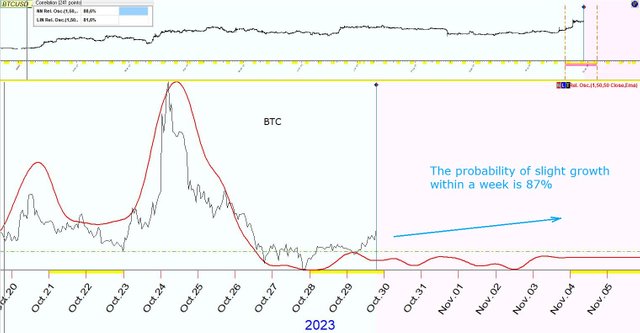
The probability of slight growth within a week is 87%
The chart below shows a simulation of the movement of the RPO indicator (Relative Price Oscillator “MA1-1, MA2-50, MA3-50”) of Bitcoin on the hourly timeframe (history from the beginning of 2023), built by a neural algorithm.
The black line is the real story of the RPO indicator.
The red line is the simulated movement of the RPO indicator.
