Chart analysis with a Bollinger Band, identify potential market tops

Photo Credit: Pixabay
This post will review the bare basics of the Bollinger Band which was created by John Bollinger. He created it to identify assets that were moving outside of the normal trading ranges, either up or down. The asset will trade within the upper and lower bands 95% of the time and 2.5% above and 2.5% below.
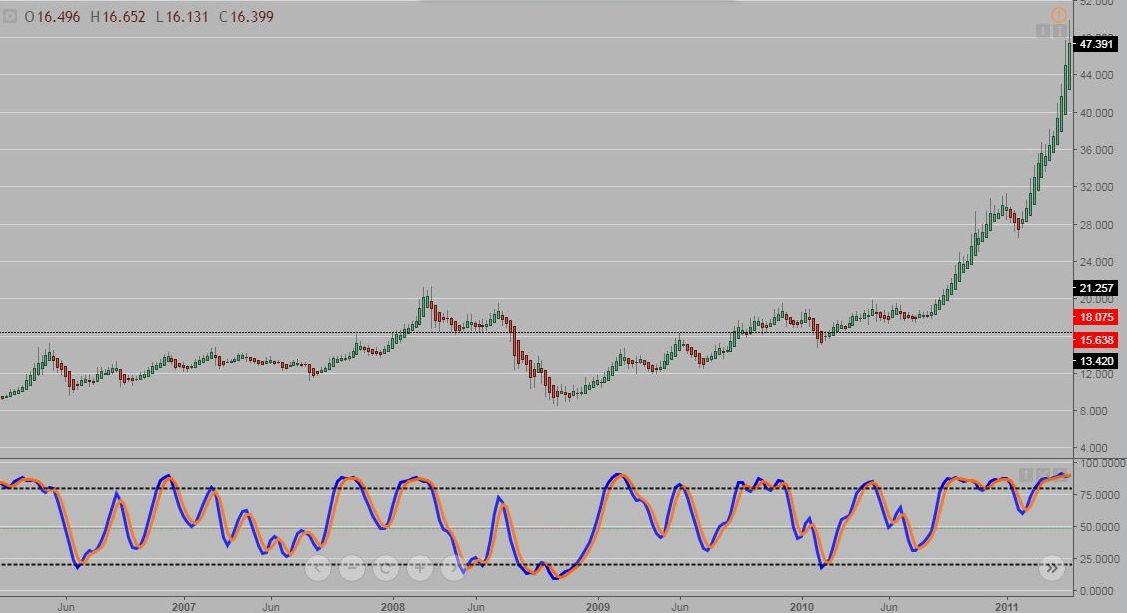
Can you identify which weekly chart this is? It is not Bitcoin.............
It is Silver and the bull run in 2011
If someone was a position trader, how would they know when to sell?
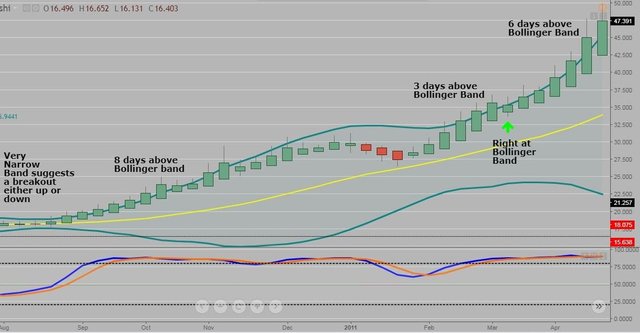
When placing a Bollinger band on the asset, you can see how many candlesticks close above the band. A extream bullish or bearish market will typically have between 3-5 days above / below the bands.
The longer the asset is over/under the band, the probability that it drops under the band increases.
Example: If an asset traded 7 days above the band, there is an extremely high probability that the next day it will close at or under the band.
Here is a closer look at the weekly Silver chart with a Bollinger band.
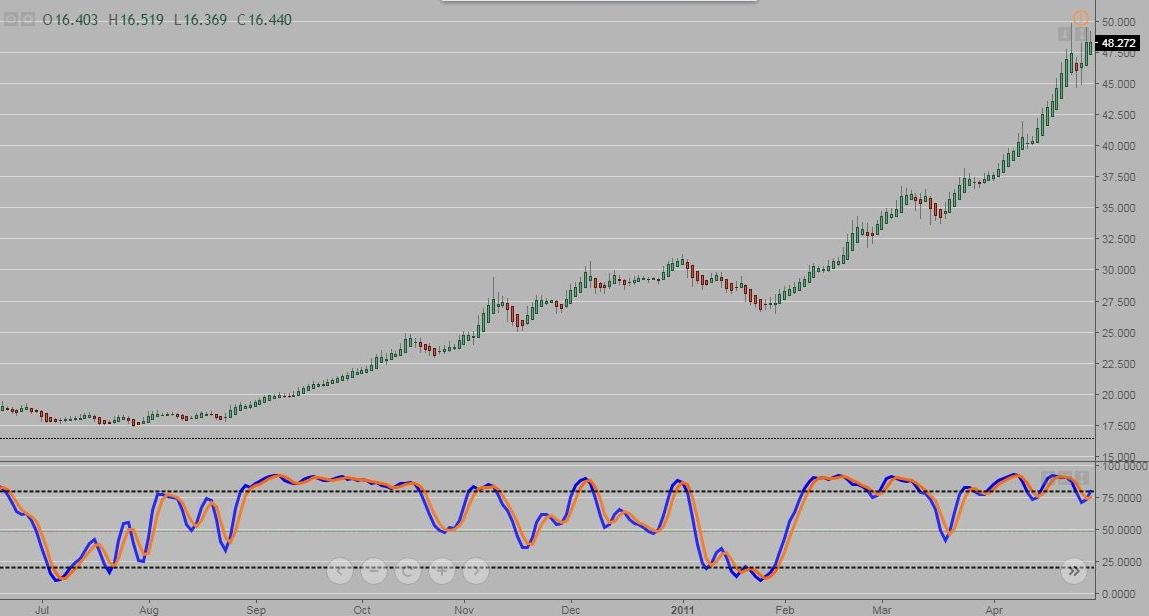
This is what the daily Silver chart looked like during the same bullish run.
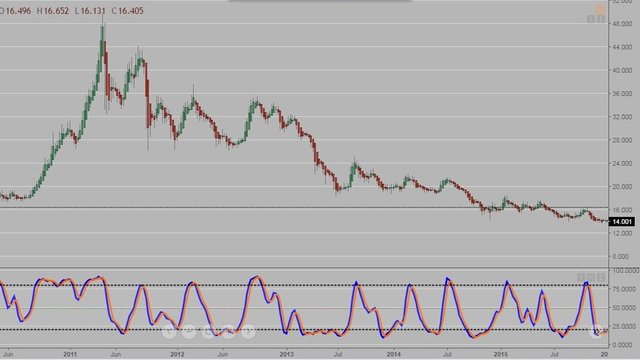
Now if someone held onto Silver, it went right into a bear market from April 2011 to December 2016, quite a long time to hold huh? And it has been in a trading range around $16 an ounce for the last year and 3 months. It's going to be a while before it reaches the 2011 peak, may a few more years...
Maybe this chart looks a little more familiar? (Maybe not as it is a weekly chart and most people look at daily charts)
It is Bitcoin..... How many days did it trade above the band?
And see how much higher it is above the band on the last candlestick? Parabolic markets will usually spike as the shorts finally bail out of their positions and the 'fear of missing out' (FOMO) investors take positions.
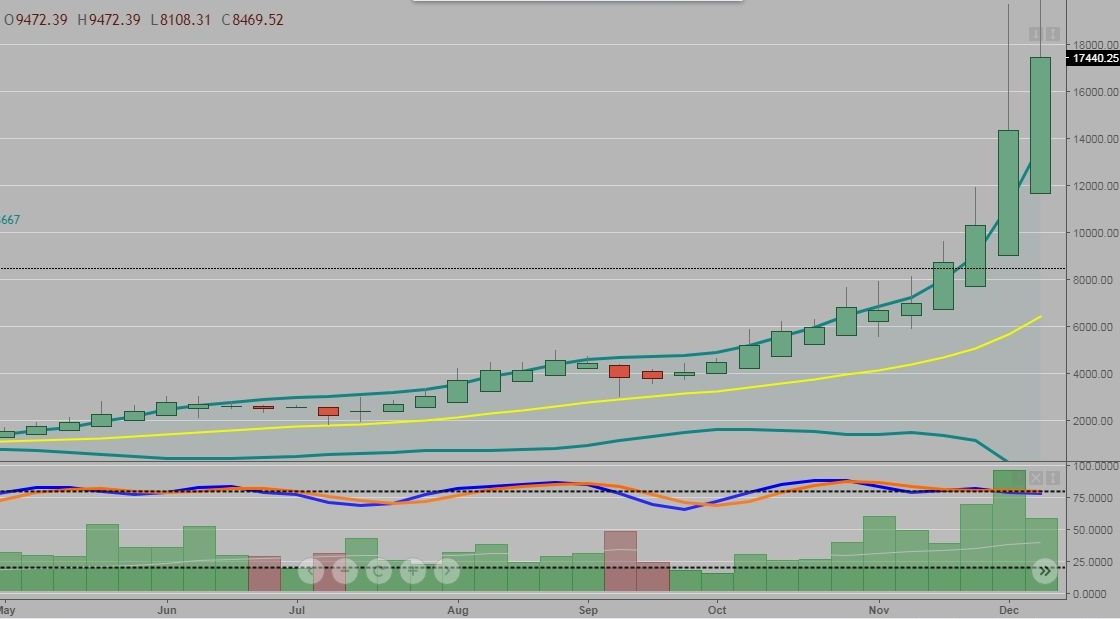
The weekly chart of Bitcoin post blow off top. While I do not think BTC will take as long as Silver to re-initiate a bull market, it may trade sideways for some time to consolidate the gains.

So take a look at the Bollinger band the next time an asset is on the move, either up or down. Sometimes it is best to exit a position (or partial position) to take profits rather than to give it all back and wait for years for the asset to recover.
Nice analysis. Good content blog. You are working hard and at right direction. Thanks for sharing.
Thanks, and it is quite a bit of work/time to blog on this platform.
You got a 11.27% upvote from @thebot courtesy of @thedawn!
Nice post, I use bollinger bands when trading forex and futures to identify extremes like you said for a potential reversion to the means. I also realize what is overbought or oversold can remain that way, so it's interesting that you quantified how long it might stay oversold/overbought...so I will have to pay attention to this in the future.
I think the Bollinger band is one essential tool for traders, it works on all timeframes too. Happy trading!
Simple yet to the point about Bollinger band. I used to use it with other indicators to show me possible reversal with with a channel but now days I don't use it too much since I discovered the BASE method that I talked about in my other posts.
There are hundreds of indicators and oscillators for bar charts, there is no perfect set that will be 100% all of the time. When you find it, let me know and we will make billions
Yes, some of the indicators are lagging indicators so, why would you want lagging information? I think volume indicator is good to use when I need to know when possible reversal and how strong it will be after like a drastic sell or buy so, I know at what price I am going to close out the position or put in a new position.
I like Fib retracement indicator.
Totally agree. Bollinger bands essential for me when charting.
Yup, a must use tool for traders.
You got a 3.23% upvote from @postpromoter courtesy of @glennolua!
Want to promote your posts too? Check out the Steem Bot Tracker website for more info. If you would like to support the development of @postpromoter and the bot tracker please vote for @yabapmatt for witness!