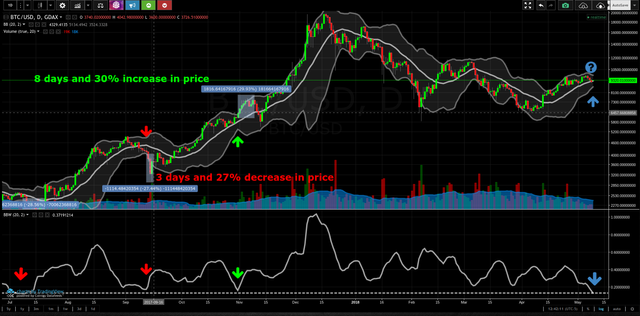
BItcoin is about to go through some turbulance
Love it or hate it, we are all fascinated by bitcoins volatility. If history is going to repeat itself bitcoin might be ready to get a little wild and crazy. Why so? Because of the current bollinger band width.
TradingView Wiki states, “Bollinger Band Width is a technical analysis indicator derived from the standard Bollinger Bands indicator. Bollinger Bands are a volatility indicator which creates a band of three lines which are plotted in relation to a security's price. The Middle Line is typically a 20 day simple moving average. The upper and lower bands are typically 2 standard deviations above and below the SMA (Middle Line). Bollinger Bands Width serve as a way to quantitatively measure the width between the upper and lower Bands. BBW can be used to identify trading signals in some instances.”
BB Width = (upper band - lower band)/ middle band. Now check out the charts and let us examine the past 5 times our bollinger bands pinched this tight. After the last pinch on October 31 2017, we grew 30% over the next 9 days. Before that September 12th. We dropped 27% over 4 days! The average days of the run followed by the pinch for the last 5 times is 9.3 days with a price change of 32%. Anyone have any extra salt and butter? We have got our popcorn ready! Like us if you are guessing we moon and leave a comment if you think we are headed downward.


Congratulations @jhomes642! You received a personal award!
Click here to view your Board
Congratulations @jhomes642! You received a personal award!
You can view your badges on your Steem Board and compare to others on the Steem Ranking
Vote for @Steemitboard as a witness to get one more award and increased upvotes!