STEEM's Travels Throughout The Year Analysis.
hi everyone! have a good time to all, steemit makes itself as a social blockchain process community-where someone can make rewards (which called steem) by writing voting sharing also improving a new blogging platform in a blockchain system,

STEEMIT platform now becomes a high reputed & well-known organization of the world, day by day it has increased more & more, today I will show some information about steem's analysis throughout the year. according to coinmarketcap (CMC) analysis chart &Information.
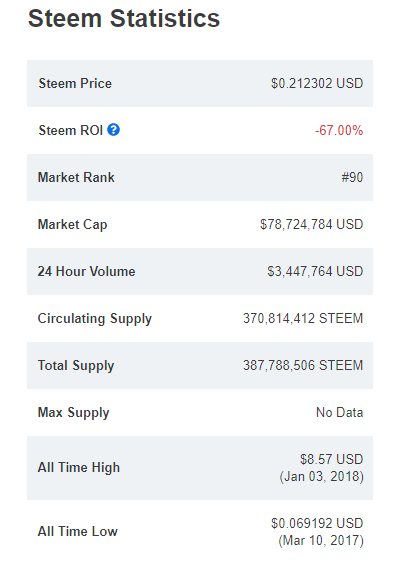
At a glance "STEEM" as on 13, July-2020.
( )
)
Here shows the All-time high value is 8.57 USD Of 1 STEEM On January 03, 2018. and all-time low value 0.069192 USD shows at 02 January-2017.
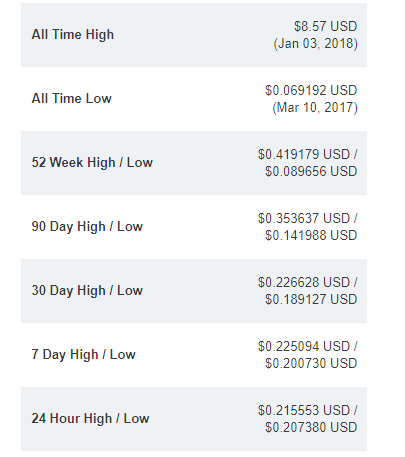
here shows a smooth journey of this currency like high/low transaction of its travel such as 7days or 30 days high/low price volume, looks good smooth travel.
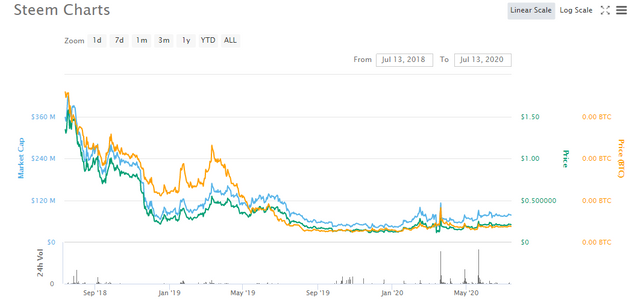
Price volume of 2 years transaction without the starting time rest of the graph shows a smooth level, the habit of strong gentle behavior shows on the graph-July,2018 to July 2020.nice
Here shows also an average price volume trap just without some extraordinary event most of the time shows very smooth travel of 'steem'.
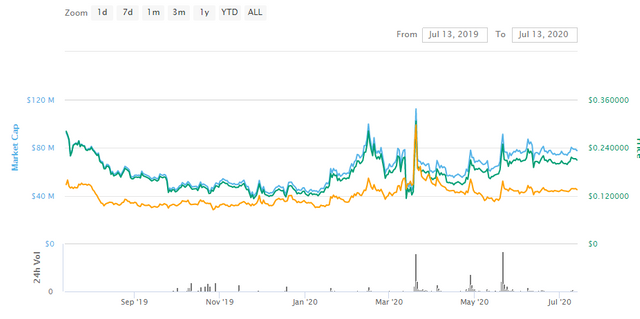
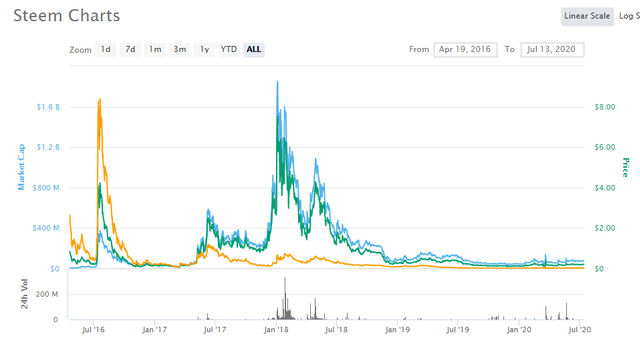
Another nice & strong travel of 'STEEM, Sign of a strong & stable currency graph-Very nice.
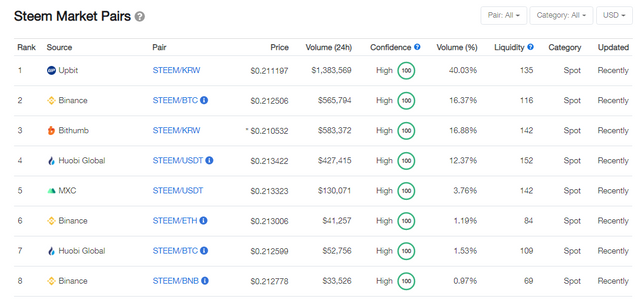
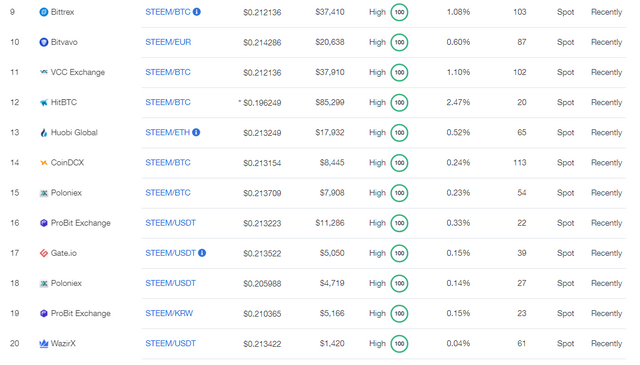
STEEM Exchange- exchange STEEM on most of the powerful market in the world.
All Information source
thanks to all-Stay safe, Make safe, Be safe,
image credit