Understanding blocktivity
Today I want to let you know about the webpage blocktivity.info. It is a very useful site that shows the activity on different blockchains and compares the amount of activity on specific blockchains to their market capitalization. This way, you can see the real value vs the perceived value of each blockchain.

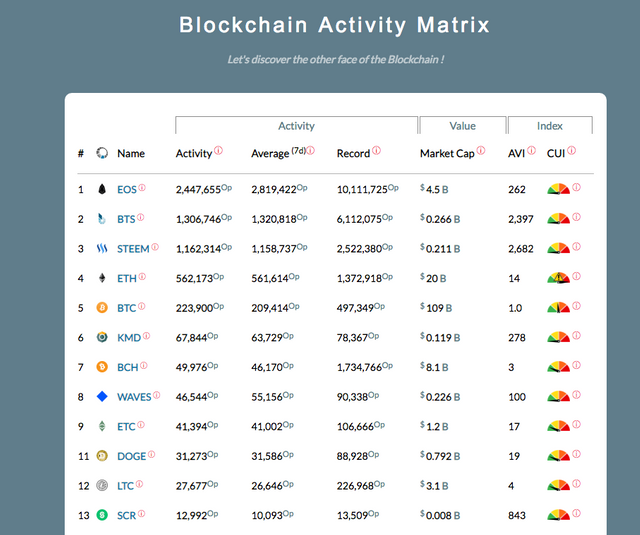
So, as you can see, the top 3 most active blockchains are all "Dan Coin's". EOS, Bitshares and Steem are all 'grapheme' blockchains designed by blockchain genius Dan Larimer (soon to be, if not already, crypto-billionaire).
You see the columns are pretty straightforward. There is coin, followed by the amount of transactions in the last 24 hours, followed by the weekly average amount of transactions / day. There is also a column showing each blockchains record day. Looking at that column, for example, we can see that EOS has done over 10 million transactions in a day vs BTC doing not quite half a million. The next column shows each coins market cap, which most crypto enthusiasts have no problem identifying, and for that reason alone, I really enjoy this page. We are not just looking at coins market cap, where BTC is king. We are looking at the use of the blockchains and then comparing it to the market cap.
The next column is where things get really interesting. AVI = Activity Valuation Index. This is a direct ratio comparison of activity on the blockchain vs market cap. They set Bitcoin's AVI at 1.0 and then compare the other blockchains to that benchmark. So, if we look at Steem's AVI, for example, we can see that it is at 2682. What this means is that, if we take into account how many transactions the blockchain is doing and compare it's transaction to market cap ratio to that of BTC, steem is doing 2682 times that of BTC.
If you care about how we get that number, read this paragraph. If you don't care... skip it. Divide the number of transactions by the market cap of any coin. That is the ratio of transactions : market cap. Do the same for BTC. Then divide the coin's ratio by BTC's ratio. That is how get the coins Activity Valuation Index.

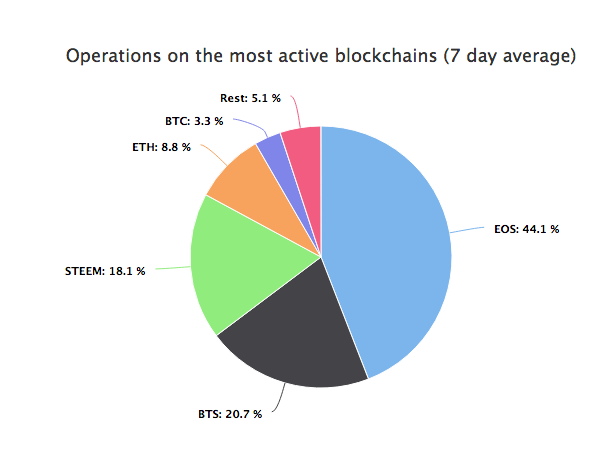
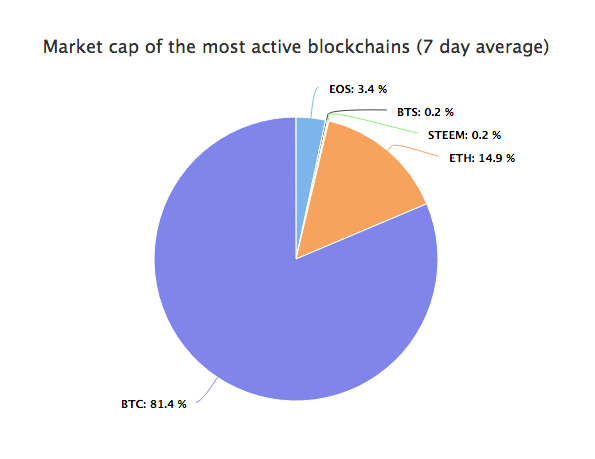
The web page also shows a few pie charts, putting things more into perspective. You can see here that EOS has done nearly half of ALL blockchain transactions. If we look at the next pie chart, we can see what EOS' market cap is.

That puts Activity Valuation Index into perspective pretty well.
I have not discussed that last column yet. This one is the kicker. This shows the Capacity Utilization Index. This is a ratio of activity on the blockchain vs the capacity of that blockchain. Ethereum is a good coin to look at for this one. We can see that Ethereum is at capacity. This is both a good thing and a bad thing. The blockchain is being utilized to its capacity. It is the only one that is. That is good news for ethereum. The bad news is that it cannot grow much beyond its current usage. You can see that it has a record of 1.3 million transactions (likely during the laggy crypto-kitties revolution). Bitcoin is at around half its capacity. Again, look at the top 3 coins. They are doing millions of transactions and can handle WAY more than that.
I find this website a very useful tool to help show me what is happening on the blockchains and which blockchains are set up for growth and are scalable. I really like the 'Dan Coins' for this reason. There is, of course, a piece of info worth noting. Transactions are not all created equal. Me uprooting your post on steem counts as a transaction. Me purchasing a sword on EOS knights counts as a transaction. Me sending $150,000 worth of BTC to a Lambo dealership counts as a transaction. So, do take this data somewhat with a grain of salt, but also see that all blockchains are not created equal.
Thank you for reading.
Coins mentioned in post: