Crypto Contest March 14: Bondly
Bondly (Uniswap: BONDLYUSDT) has broken out of the triangle pattern in the daily chart.
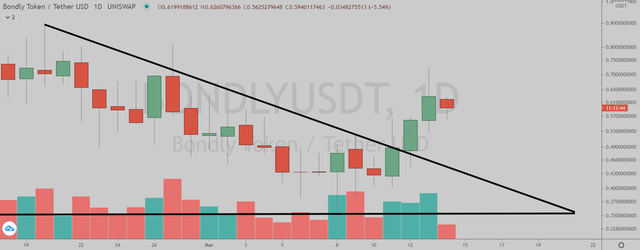
(Chart courtesy of Tradingview.com (log scale))
Elliott Wave Analysis
In Elliott Wave terms, BONDLY began a red wave one advance on January 11. The red wave one (blue sub-waves i-ii-iii-iv-v) peaked on February 20 and the red wave two (blue sub-waves a-b-c) correction ended on March 8. If this wave count is correct, BONDLY should be heading next towards the February 20 peak in the red wave three.
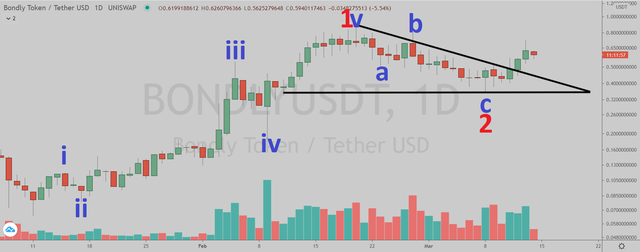
(Chart courtesy of Tradingview.com (log scale))
Funnymentals
Bondly is interoperable, transparent and portable swap designed to make your wallet into your own crypto and NFT marketplace. BlockchainBrad interviewed the CEO one month ago.
(Sources: https://www.bondly.finance/)How Will Bondly Trade?
Bondly (Uniswap: BONDLYUSDT) daily chart by Tradingview.
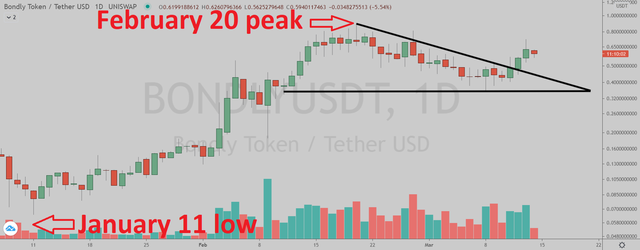
(Chart courtesy of Tradingview.com (log scale))
Prizes
I will be giving upvotes to the correct answers with minimum reputation of 25.
Rules
This poll will expire in one week. Only one vote per person.
Which one will happen first?
Please select one of the three choices and comment below.
BONDLY will takeout the February 20 peak
BONDLY will drop below the January 11 low
BONDLY will stay in a trading range between the January 11 low and the February 20 peak until April 20
BONDLY will takeout the February 20 peak
BONDLY will stay in a trading range between the January 11 low and the February 20 peak until April 20
Correct. Upvoted your comment:
https://steemit.com/blockchain/@stnr/qrsp9h
BONDLY will drop below the January 11 low
BONDLY will drop below the January 11 low
BONDLY will stay in a trading range between the January 11 low and the February 20 peak until April 20
Correct. Upvoted your comment:
https://steemit.com/blockchain/@gretna/qrsp57
BONDLY will drop below the January 11 low
BONDLY will takeout the February 20 peak
BONDLY will drop below the January 11 low
BONDLY will takeout the February 20 peak
BONDLY will drop below the January 11 low