Crypto Contest July 24: Syscoin
Syscoin (Bittrex: SYSBTC) has broken out of the triangle pattern in the monthly chart.
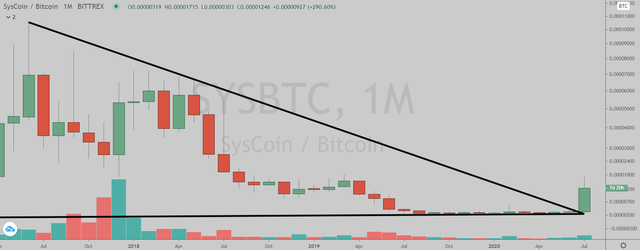
(Chart courtesy of Tradingview.com (log scale))
Elliott Wave Analysis
In Elliott Wave terms, SYS began a red wave one advance in November 2014. The red wave one (blue sub-waves i-ii-iii-iv-v) finished in June 2017, and the red wave two (blue sub-waves a-b-c) correction ended in August 2019. If this wave count is correct, SYS should be heading next towards the June 2017 peak in the red wave three.
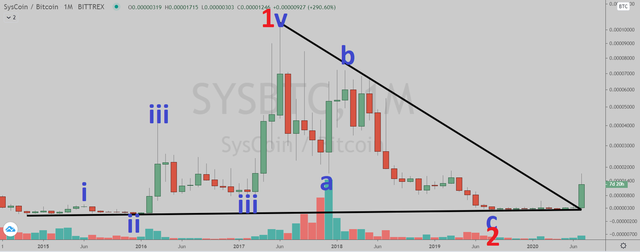
(Chart courtesy of Tradingview.com (log scale))
Funnymentals
Syscoin Platform provides trustless interoperability, token and asset microtransactions that are scalable, and bitcoin-core-compliant security. You can find out their latest news here.
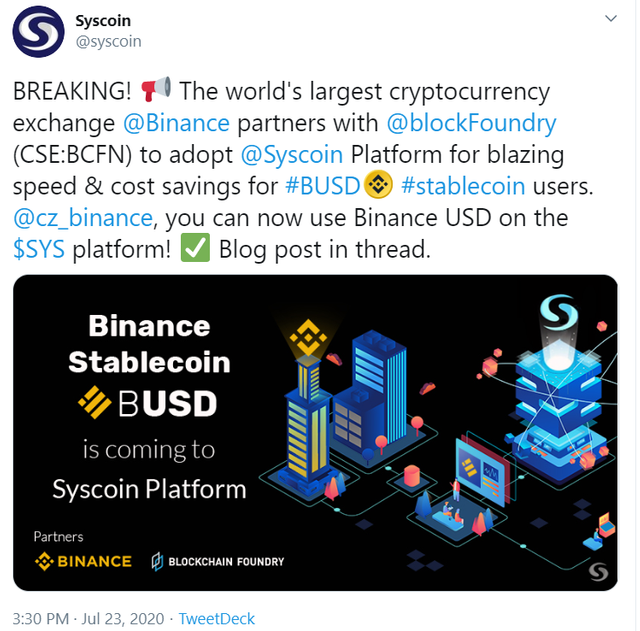
(Sources: https://syscoin.org/)
How Will Syscoin Trade?
Syscoin (Bittrex: SYSBTC) weekly chart by Tradingview.
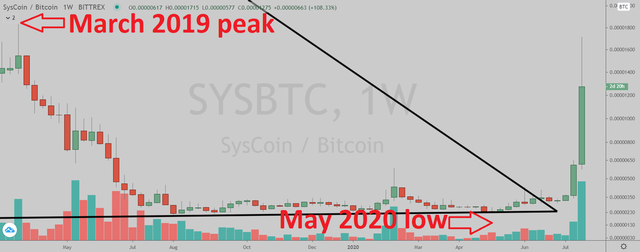
(Chart courtesy of Tradingview.com (log scale))
Prizes
I will be giving upvotes to the correct answers with minimum reputation of 25.
Rules
This poll will expire in one week. Only one vote per person.
Which one will happen first?
Please select one of the three choices and comment below.
SYS will takeout the March 2019 peak
SYS will drop below the May 2020 low
SYS will stay in a trading range between the May 2020 low and the March 2019 peak until August 29
SYS will takeout the March 2019 peak
SYS will stay in a trading range between the May 2020 low and the March 2019 peak until August 29
Correct. Upvoted your comment:
https://steemit.com/blockchain/@moneyandmoney/qfnl1y
SYS will takeout the March 2019 peak
SYS will takeout the March 2019 peak
SYS will drop below the May 2020 low
SYS will drop below the May 2020 low
SYS will drop below the May 2020 low
SYS will takeout the March 2019 peak
SYS will takeout the March 2019 peak
SYS will stay in a trading range between the May 2020 low and the March 2019 peak until August 29
Correct. Upvoted your comment:
https://steemit.com/blockchain/@calg/qfqy6e