A Year in Review (BTS) Bitshares Cryptocurrency Technical Analysis
Price charts of Bitshares by Coinigy, traded on Poloniex. From last year to this year, monthly technical analysis predictions and actual results, with commentary. Provided by DigitalCurrencyTraders
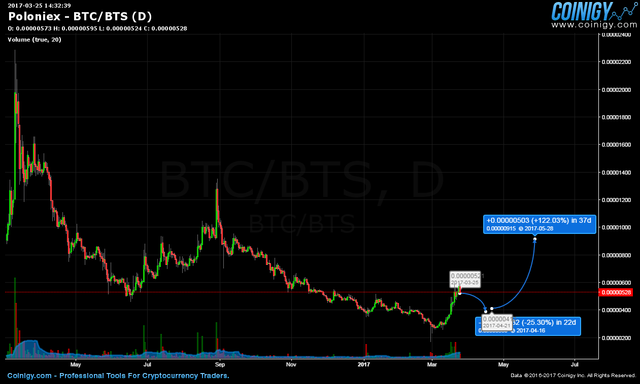
March 25 2017
March 2017 saw a capitulation low earlier in the month with a strong move up to reach support and resistance areas from historical charts reaching back to spring of 2016. This chart predicted a retracement of prices before a predicted larger move to the upside.
April 2017
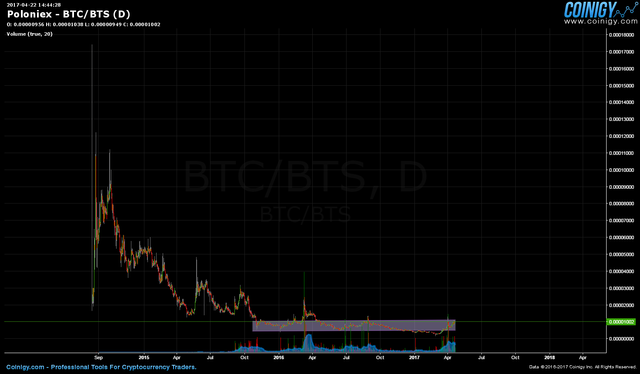
April 22 of 2017 chart shows a longer term perspective of the long downtrend that Bitshares had seen, reaching back to the highs in autumn of 2015, the down trend had continued, but had created more than a year of prices that traded withing a narrow range. At this time, prices were edging against the top of this range, and a break above these levels would be a classic buy signal.
May 2017
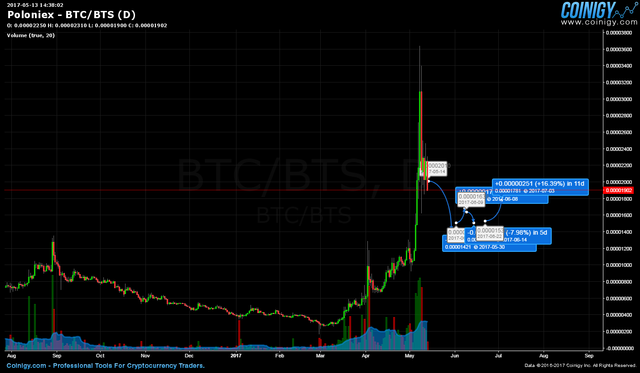
May of 2017 shows a closer view with a year of data. The retracement predicted in march did not occur until early april, and them prices went parabolic as they broke through the longer term range as pictured above. After this meteoric rise, I was predicting more sideways action for a number of months.
June 2017
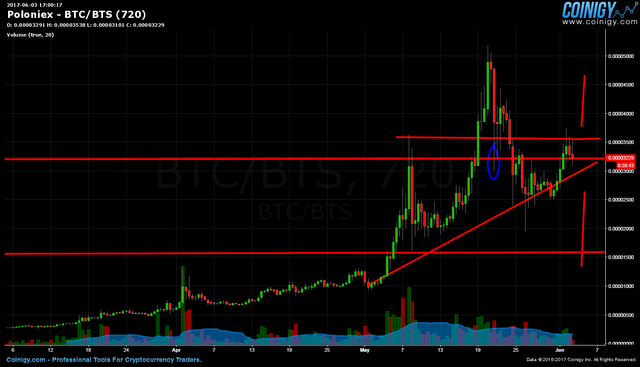
However, by early June, we could see the early May price surge was only the beginning, and after a small consolidation prices surged again in a strong trend for more than a week straight before topping and dropping back to early May lows. The price prediction here is uncertain, and generally a hold or sell formation for my Simple Trading Method
July 2017
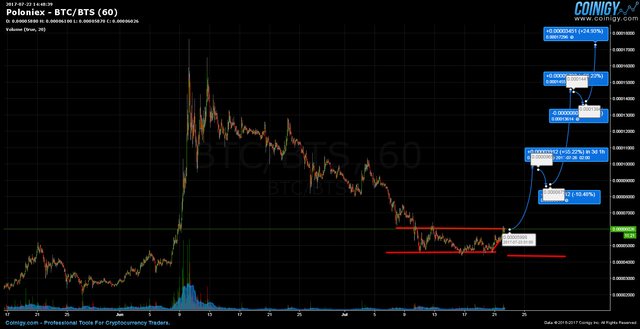
July 22 and we see prices continued to slide on consistent selling throughout the end of June and for the entire month of July. A consolidation pattern emerged in the last three weeks of this chart. At this time at the end of July, the bull run was finished for all the alts, and we know now that prices declined for six months after this - but - I was reading every consolidation as a flag that the BULL would return to #cryptocurrency markets
August 2017
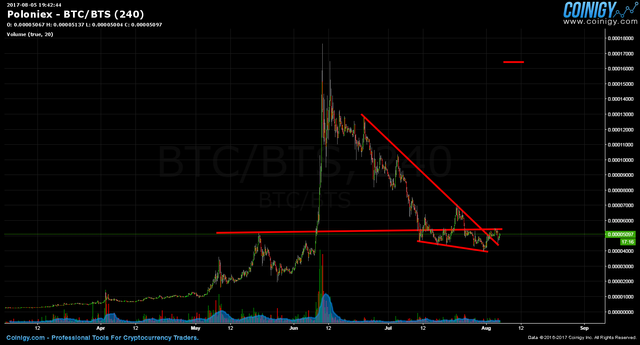
By mid august the consolidation pattern was showing conflicting signals of weaker prices, lower lows and lower highs, and I was drawing trendlines to support my BULL BIAS that, in hindsight is very obvious in all my chart reading through this time.
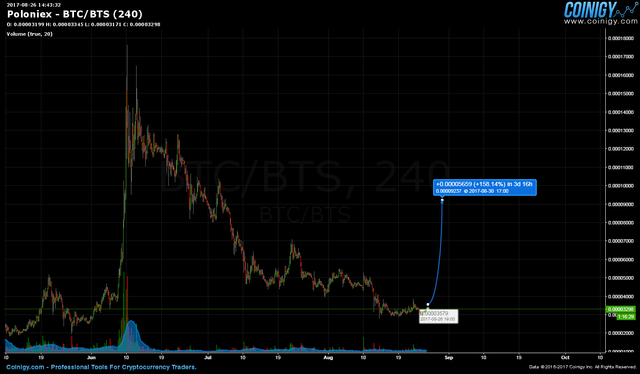
Late August 2017 - prices slide off from earlier consolidation, and again set a bottom that could be related to historical support and resistance... Again I was anticipating a strong breakout, that did not come.
September 2017
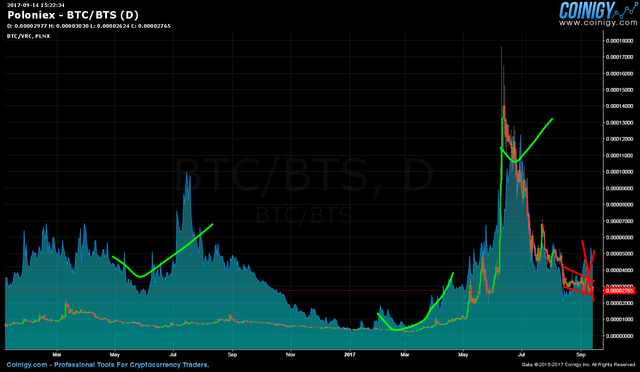
Mid september 2017, and I methodically reviewed all the charts to find those that matched four criteria that was to identify which markets might be ready to take off higher - this market did not match all four requirements, as many others did not. This is the first month I started overlaying the relative price of bitcoin VS the price of the coin.
October 2017
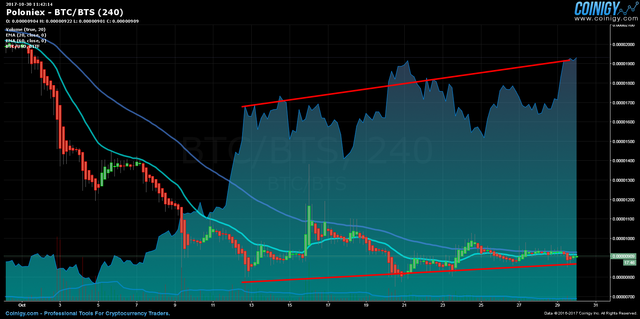
End of October 2017 - While watching the price of bitcoin climb, I was studying all the charts to identify WHEN the alts would start matching the price of bitcoin and move along with it, as they had in April - July... The consolidation was a potential 1-2-3 bottom along with 3 month EMA crossover approaching... things were looking bullish, but no bull move predictions were included in the chart.
November 2017
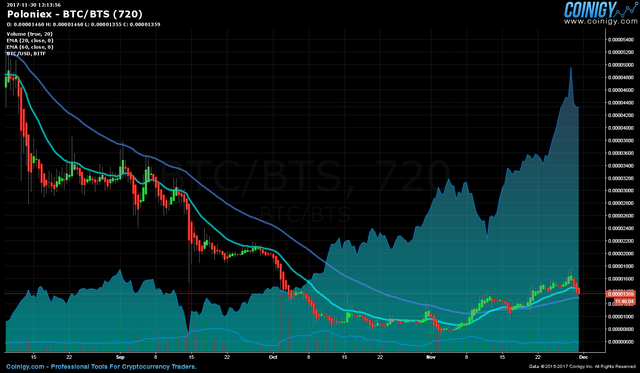
End of November 2017, a new low occurred in early November, negating the potential bottom that was so strong in October, but then proceeded to create a new 1-2-3 bottom and a confirmed EMA crossover - rising at the same time that bitcoin prices were showing great strength.
December 2017
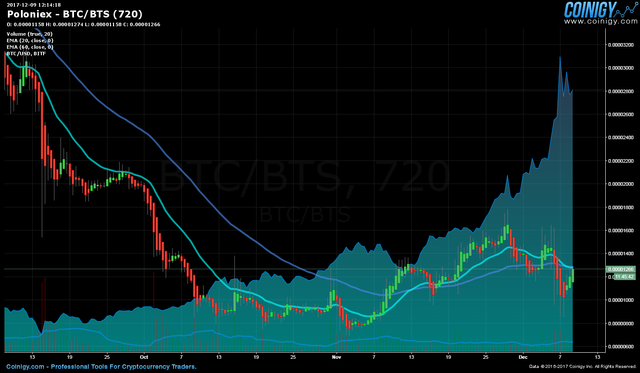
Mid december 2017, Bitshares dropped back while bitcoin reached all time highs, and the 3 month EMA crossed over to a bear signal. Important to note the strong buying candles at the end of November and early December as may bull buyers were excited and anticipating a stronger move.
February 2018
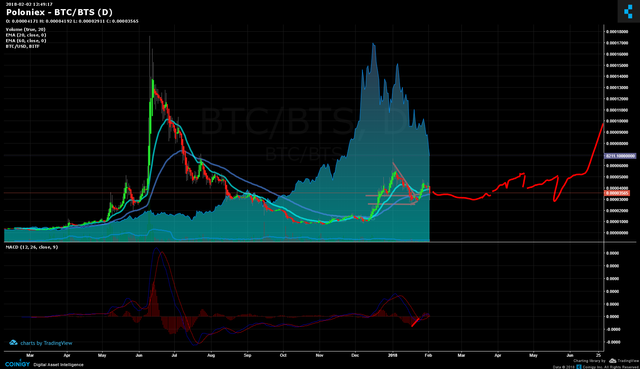
Through late december 2017, bitshares made a fantastic run starting just after bitcoin topped from All Time Highs and dropped back. throughout January 2018, bitcoin price dropped and Bitshares prices dropped against bitcoin. Here on Feb 2 2018 the red line is a prediction running months into the future
March 20 2018
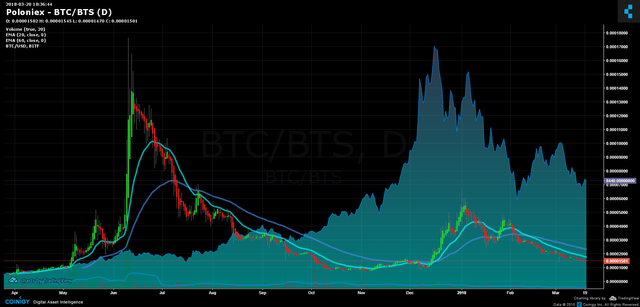
Long term view of prices in late march 2018 show the February prediction was not bearish enough. bitshares prices slid off steadily in a very similar pattern to what we saw from August to November 17
The three month view from the same date in March 2018 - the down trendline marks a point where the first of three key trading signals may occur. First we expect to see the breach of this down trendline, and a formation of a 1-2-3 bottom, followed by a break to higher prices at the same the the 3 month EMA crosses over.
Brought to you by http://digitalcurrencytraders.com
---
Also find
AMP - A Year of Synereo AMP Price Reviews
ARDR - One Year ARDR Technical Analysis
BCN - One Year Bytecoin Technical Analysis Charts
BELA - Belacoin Technical Analysis March 2017 to March 2018
Bitshares has broken the down trendline, confirmed a breakout of the 1-2-3 bottom, and the 3 month EMA is approaching crossover now.