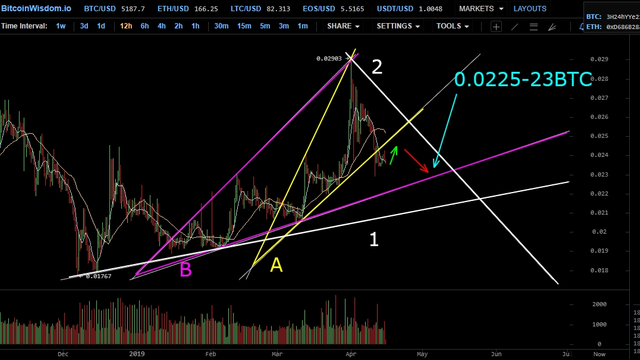
DASH/BTC. The probable movement of the price of the "DASH" token in the next two or three weeks.

Hello, gentlemen..
It's time to remember DASH.
As a basis, I took the stock chart from the "Exmo" exchange, since the history of this token is most fully expressed here.
The timeframe is 12 hours.
But first of all we need to remember the rule of the pattern "Ascending expanding wedge". This rule states that in 90% of cases you should expect the price to fall below the lower line of the wedge

Lines 1 and 2 are the main support and resistance lines.
"Ascending expanding wedge" - A and B.
According to the rule, the price of the coin went down from the yellow "pattern A", continuing to remain in the purple "pattern B"*. In the near future, a slight increase in the price is possible, but in any case, the price will tend to the point of intersection of the line 2 and the lower line of the purple pattern 2. Most likely, the price may fall to the level of 0.0225-23 BTC.
It should be understood that the lower line of the pattern 2 is also a local support line, so it is not clear where the price will go after the intersection point.
Since DASH is very strongly associated with bitcoin, the stock chart of this coin indirectly indicates us the upcoming similar movement of BTC.
Good luck!
The @upvoteinvest team
A formal disclaimer
Some of the posts might contain our opinion on trading strategies based on our technical and fundamental knowledge. However, please, invest at your own risk. We can’t be held responsible for any losses.