Weekly Price Analyis of Bitcoin Cash BCH/USD Forming Bottom?
Key Points
Bitcoin cash price declined heavily this past week and broke the $400 support against the US Dollar.
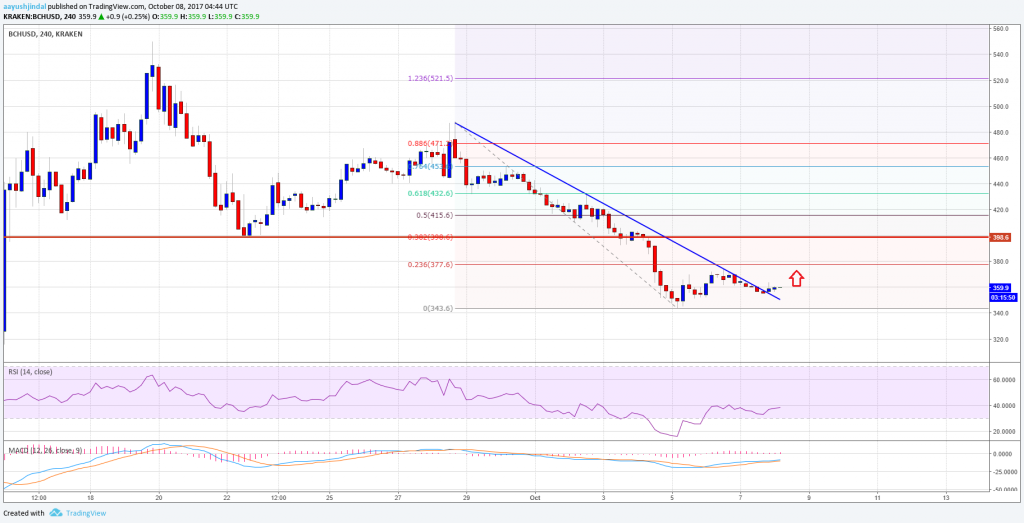
Recently, there was a break above a bearish trend line with resistance at $350 on the 4-hours chart of BCH/USD (data feed from Kraken).
The pair needs to gain momentum above the $380 level to move back in the bullish zone.
Bitcoin cash price after a sharp decline against the US Dollar formed bottom. BCH/USD is now correcting higher towards $400 and might gain pace.
Bitcoin Cash Price Upside Break
This past week there was a continuous decline in BCH price from the $450 high against the US Dollar. The price followed a declining path and moved below the $420, $400 and $380 support levels. It traded as low as $343 and it seems like the price is now forming a bottom. It is slowly moving in a range above $340 and forming a consolidation pattern. There was a break above a bearish trend line with resistance at $350 on the 4-hours chart of BCH/USD.
It has cleared the way for more gains above $350 in the near term. An initial resistance on the upside is around the 23.6% Fib retracement level of the last decline from the $486 high to $343 low. However, it won’t be easy for buyers to gain momentum above $380. The next major hurdle is near the 38.2% Fib retracement level of the last decline from the $486 high to $343 low at $390. The mentioned $390 level was a support earlier and now it would stop upsides in BCH.

However, the recent break is a positive sign above $350. As long as the price is above $340, it could attempt a break of $380.
Looking at the technical indicators:
4-hours MACD – The MACD for BCH/USD is almost neutral in the bearish zone.
4-hours RSI (Relative Strength Index) – The RSI for BTC/USD is recovering for the 30 level.
Major Support Level – $340
Major Resistance Level – $380
Charts courtesy – Trading View, Kraken