"Bitcoin's Bullish Rebound: Navigating Through Fear to Find Opportunity"
In the ever-evolving landscape of cryptocurrency, understanding market sentiment and technical indicators is crucial for navigating potential investment opportunities. This analysis dives deep into the current state of Bitcoin, examining recent price actions, historical cycles, and the pivotal role of market sentiment. As we stand at what might be a turning point, let's explore whether the prevailing fear in the market could signal the onset of a new bullish phase. Whether you're a seasoned trader or a curious observer, this piece aims to provide insights that could help in making informed decisions in the volatile world of Bitcoin.
Price action
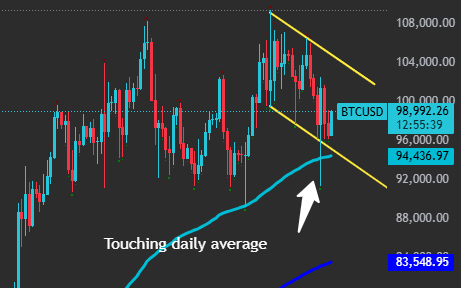
Since hitting a new high of $109,400 on January 20, the price has been trending downward to test lower levels. This trend, marked by two parallel yellow lines. The most significant recent daily candle occurred on February 3, where the price failed to break below the previous low of $89,500, showing a long tail, which suggests bullish momentum. However, confirmation is needed to ensure selling pressure has eased and liquidity has been exhausted. Thus, $89,500 is still a vital support level.
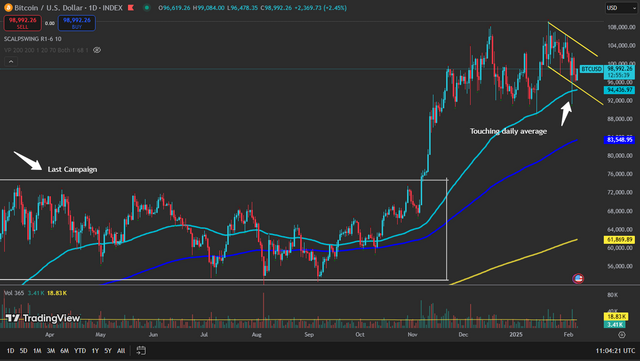
Current phase starting November 12, 2024, shows less market activity compared to the last campaign (Feb 28 - Nov 8, 2024), leaning towards re-accumulation than distribution campaign.
The key now is how quickly major players can accumulate what they need to reignite the upward trend. I expect a more professional affair, with some volatility and maneuvers.
Volume Insights
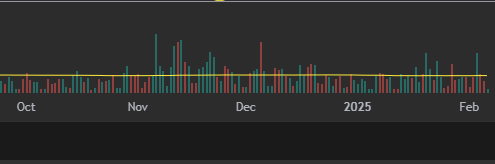
Compared to the previous campaign, the volume hasn't escalated enough to indicate distribution; it's more indicative of mid-campaign activity. Still, we need to observe lower volume, to signaling the start of a new trend.
The February 3 volume spike might be a spring (shakeout) for less seasoned sellers, setting the stage for future price movements. Right now, is more like making a cause for the effect that we expect to see in the near future.
Average
The Price is currently above the daily average (green line) with a successful test, but the close on February 4 suggests more consolidation at lower levels might be needed.
Holder Dynamics
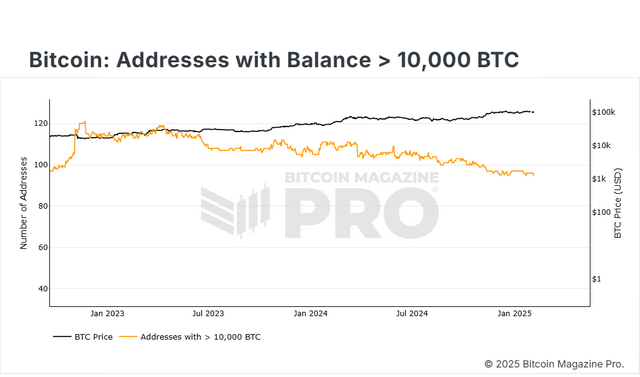
There's been a decline in addresses holding over 10,000 BTC since March 24, 2024 with no significant recovery, which is concerning aspect.
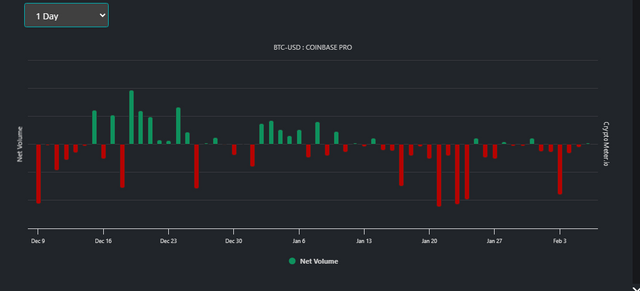
Also, Coinbase net volume shows distribution trends in the last two months.
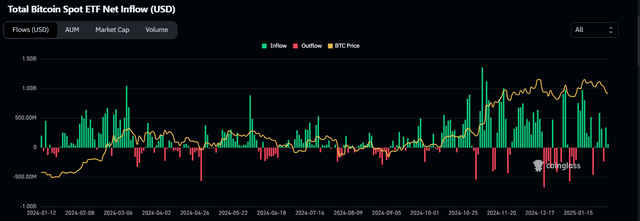
In contrast, among the key ETF players, IBIT and FBTC continue to buy aggressively, while GBTC has reduced its holdings since early 2024.
An interesting development is the wallet activity on February 5, with an inflow of 122.05K BTC, suggesting liquidity is being absorbed, which could be a bullish indicator.
![]()
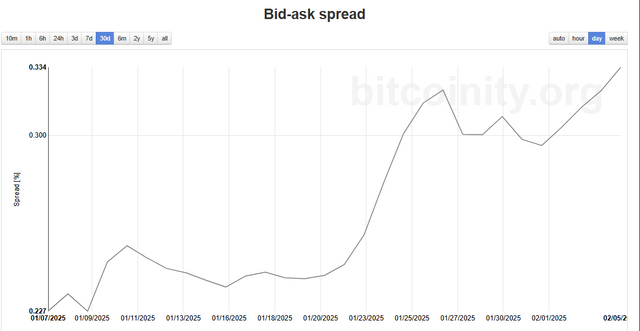
Bid-Ask Spread
The Bid-Ask Spread has been widening since January, suggesting continued upward pressure if prices go above $100K.
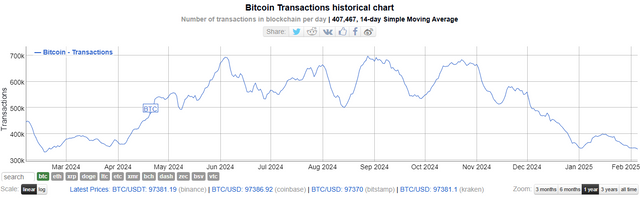
Transaction Activity
The Bitcoin transaction chart also tapered off since February 2024, and stay at critical point, hinting at an upcoming significant market move, either up or down.
Liquidation
In terms of liquidation, as a rule, price goes from one liquidity zone to another. After hitting $96K on February 3, the next liquidity zone to watch is $110K.
-2025-02-06_14_38_04.png)
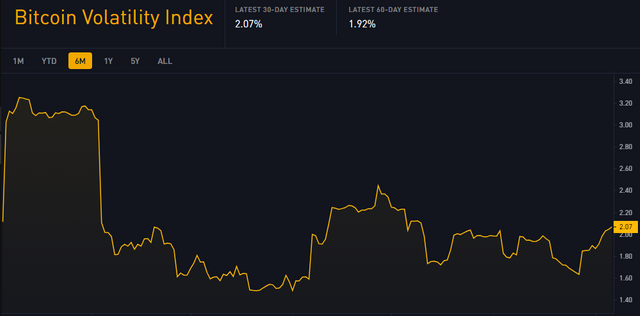
Volatility and Leverage
Since September 2024, market volatility has been relatively low but is beginning to increase, which could hurt retail traders on high leverage, especially with leverage ratios fluctuating since January 17.
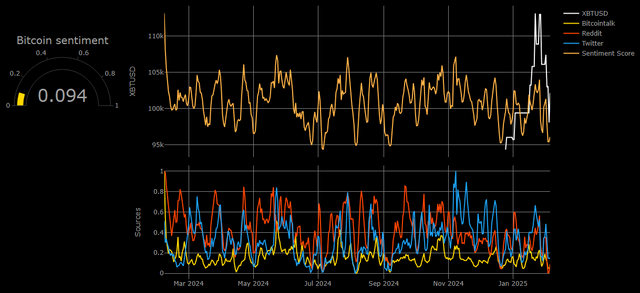
Sentiment
Lastly, the Fear and Greed Index is at a low 38, with social media sentiment (Twitter, Reddit, and Bitcointalk) at 0.094.
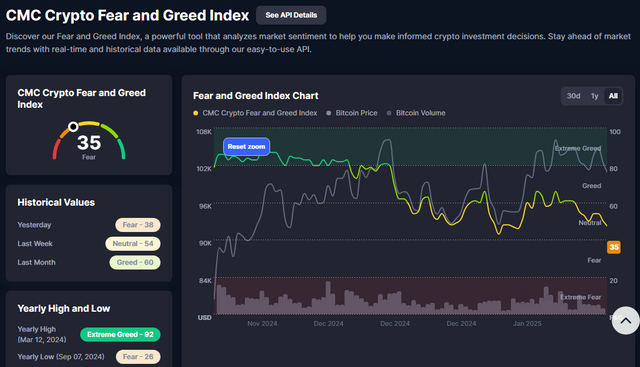
This level of fear among traders is indicative of a market where pessimism is high, and there's a general expectation of price drops. This level of fear might end in panic, but also historically, such low sentiment scores have often preceded significant bullish reversals, as fear can lead to capitulation or selling off at the bottom, setting the stage for recovery.
Institutions often enter the market during low sentiment periods, following the strategy of buying when there's "blood in the streets." This was notably evident in 2020 when institutions like MicroStrategy began accumulating Bitcoin despite prevailing negative sentiment. Today's low sentiment might be attracting similar strategic buying from institutions, especially with the ongoing activities of ETFs like IBIT and FBTC. However, it's crucial to stay vigilant for any macroeconomic shifts or regulatory changes that could alter these patterns.
Conclusion
While technical indicators show mixed signals, the overall analysis suggests potential for a bullish turnaround if current market dynamics persist. Watch for confirmations in price action, volume, and institutional buying patterns. Remember, broader market conditions can also sway Bitcoin's trajectory.
"Disclaimer: This analysis reflects personal insights based on historical data and current market indicators. The crypto market is highly volatile; always conduct your own research and consider your risk tolerance before making investment decisions. Share your thoughts or insights in the comments below – how do you interpret the current market sentiment?"