BITCOIN - Price Analysis - June 16th 2018
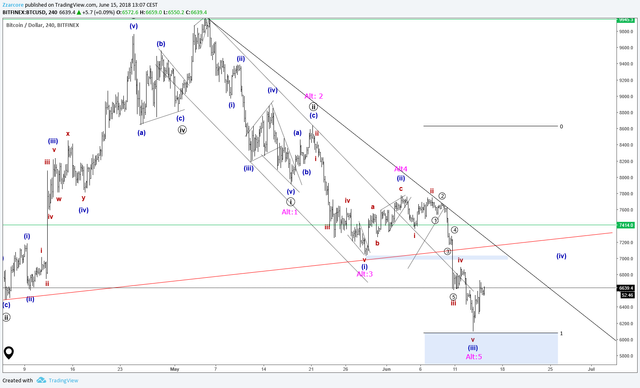
Yesterday I posted:

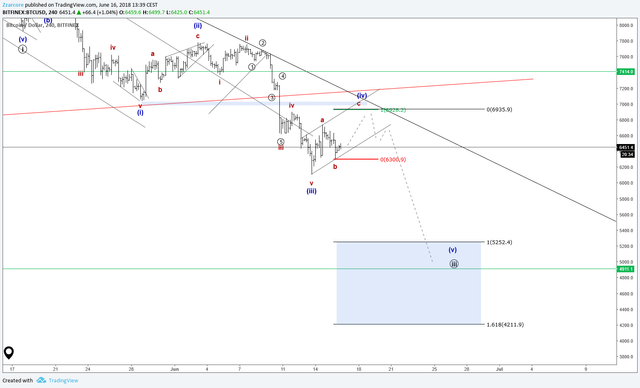
Since then I cleaned the chart a little bit. Removed the alternate count because it became very unlikely. The first leg up of the correction has a clear ABC structure. I still expect more upside because the correction is too short, but it could be over. Also wave 4 could become a triangle or running flat, thats why you generally don't trade corrections. You just wait for them to be finished and then short.
After this correction is finished, we expect more downside. The fifth wave of third wave can often extend and be very swift in a bear market. The size and the speed of the move down can catch a lot of people off guard, making them panic sell and accelerate the move further.
The correction could move up to the green line. The red line is just a warning sign for myself that the correction already could be over, especially if it gets broken with a swift move down. If bitcoin makes a new low overall, this is definitely a sign that wave 5 has started.
