Bitcoin price analysis with simple calculation
Bitcoin price fell above 60% since its last high reaching $20,000/USD at mid-Dec, sitting at around $8000. Some other crypto-currency fell even up to 80%.We are intuitively knowing that bitcoin is worth to invest at the current price range than when it is at around $16,000 or $20,000.
But how exactly do we know it is at its bottom?
No we don’t, unless we are big whales who manipulate the price of crypto-currency market. However there some few simple calculations out there to calculate is it reasonable to invest in crypto-currency now.
Assuming the fundamentals of blockchain & crypto-currency do not change in the near future, the price of bitcoin should perform similar to the last couple of years.As such, we have did some calculation of the average daily % change of the bitcoin price for the last 4 years. Someday it went up someday it went down, and the daily average % change from Sep 2013 – Oct 2017 is +0.353%, in a compounded way.
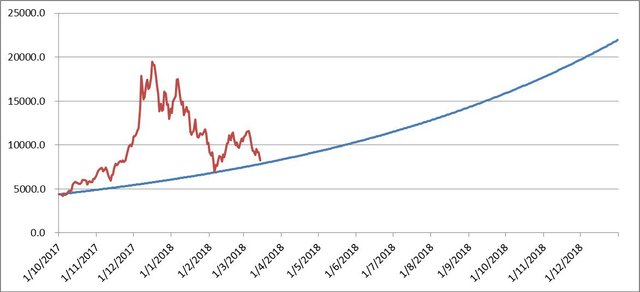
Base on the daily average % of the bitcoin price, we have plotted a simulation line of the future bitcoin price and the real bitcoin price since Oct 2017 to Mar 2018 :

The graph has shown that the blue trend (bitcoin price prediction with our simple calculation) trending upward, where the red line is the actual bitcoin price. We can see clearly the Dec 2017 hype where bitcoin price increased way above the long term trend line we simulated. As the fundamentals did not improve correspondingly with the magnitude of the sharp rise of price, there should be a correction (If there is such big improvement of blockchain technology and real-world adoption at the time when the price rose, it is reasonable and not considered as a bubble. More studies on : blockchain technology and real-world adoption in the future).
With a few months of observation, we see that the price hardly fall below the blue line, only once in 06 Feb the bitcoin price dropped below $6000 but recovers within the same day. This is not to say that bitcoin price will not fall below the blue prediction line, but based on the observation it is a good entry point when bitcoin price hits the blue prediction line or fall below the line.
With the average price calculated by the past 4 years data, it is predicting that bitcoin price with reached $22,000 at the end of 2018, as long as the fundamentals do not change significantly.
This is just a very simple calculation of the bitcoin price analysis. There are many factors that should be considered into such as :
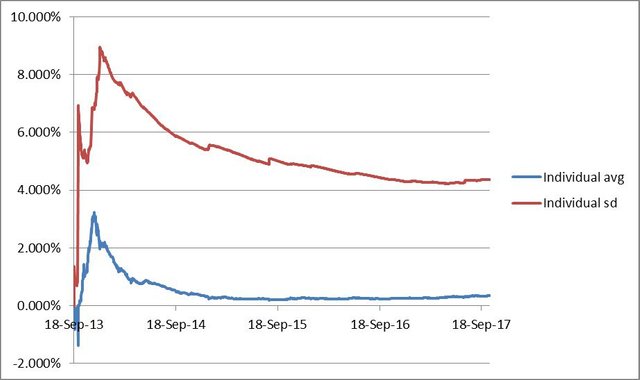
i) The daily average % change in the long term dropped as the price goes higher (+0.353% daily average drops as price goes up exponentially)

Daily average % and standard deviation over the past 4 years
ii) The “month” factors, where some particular month does have tendency of price patterns, such as the January drop for the last 4 years, However sample size is too low to make any conclusions.
iii) Government, banks interfering and regulating : It is very probable countries will implement taxes, laws and regulations for the coming few years and will affect not only the price but the real-world adoption of blockchain.
We can test the simple calculation on other investment products too and there might be surprising findings, you can do the same with other crypto-currency too! An reminder this is not any financial advise but only observation and prediction, please do full research before any investment decision.
Reference : daily price predictions base on the simple calculation (up to dec-2018 only, as daily average % needs to be adjusted over time, it will be not reasonable to keep the line going on compounding at the same rate) :
