Bitcoin Technical Analysis: Could be about to break up, or break down soon?
Bitcoin loves triangles!
Whenever we see a large price rise in bitcoin (as was the case from April to June), or a large price drop, a 'triangle' formation may typically emerge during the consolidation period which follows. In fact, in my experience it's pretty strange if one does not occur! The triangle pattern is normally relatively symmetrical around the horizontal (upper edge and lower edge have similar angles), so it's this type of triangle that I look for. Once such a formation has started to emerge, you can try to make money by buying when it hits the bottom edge and selling when it hits the top edge, but this only works if it stays within the bounds you are expecting.
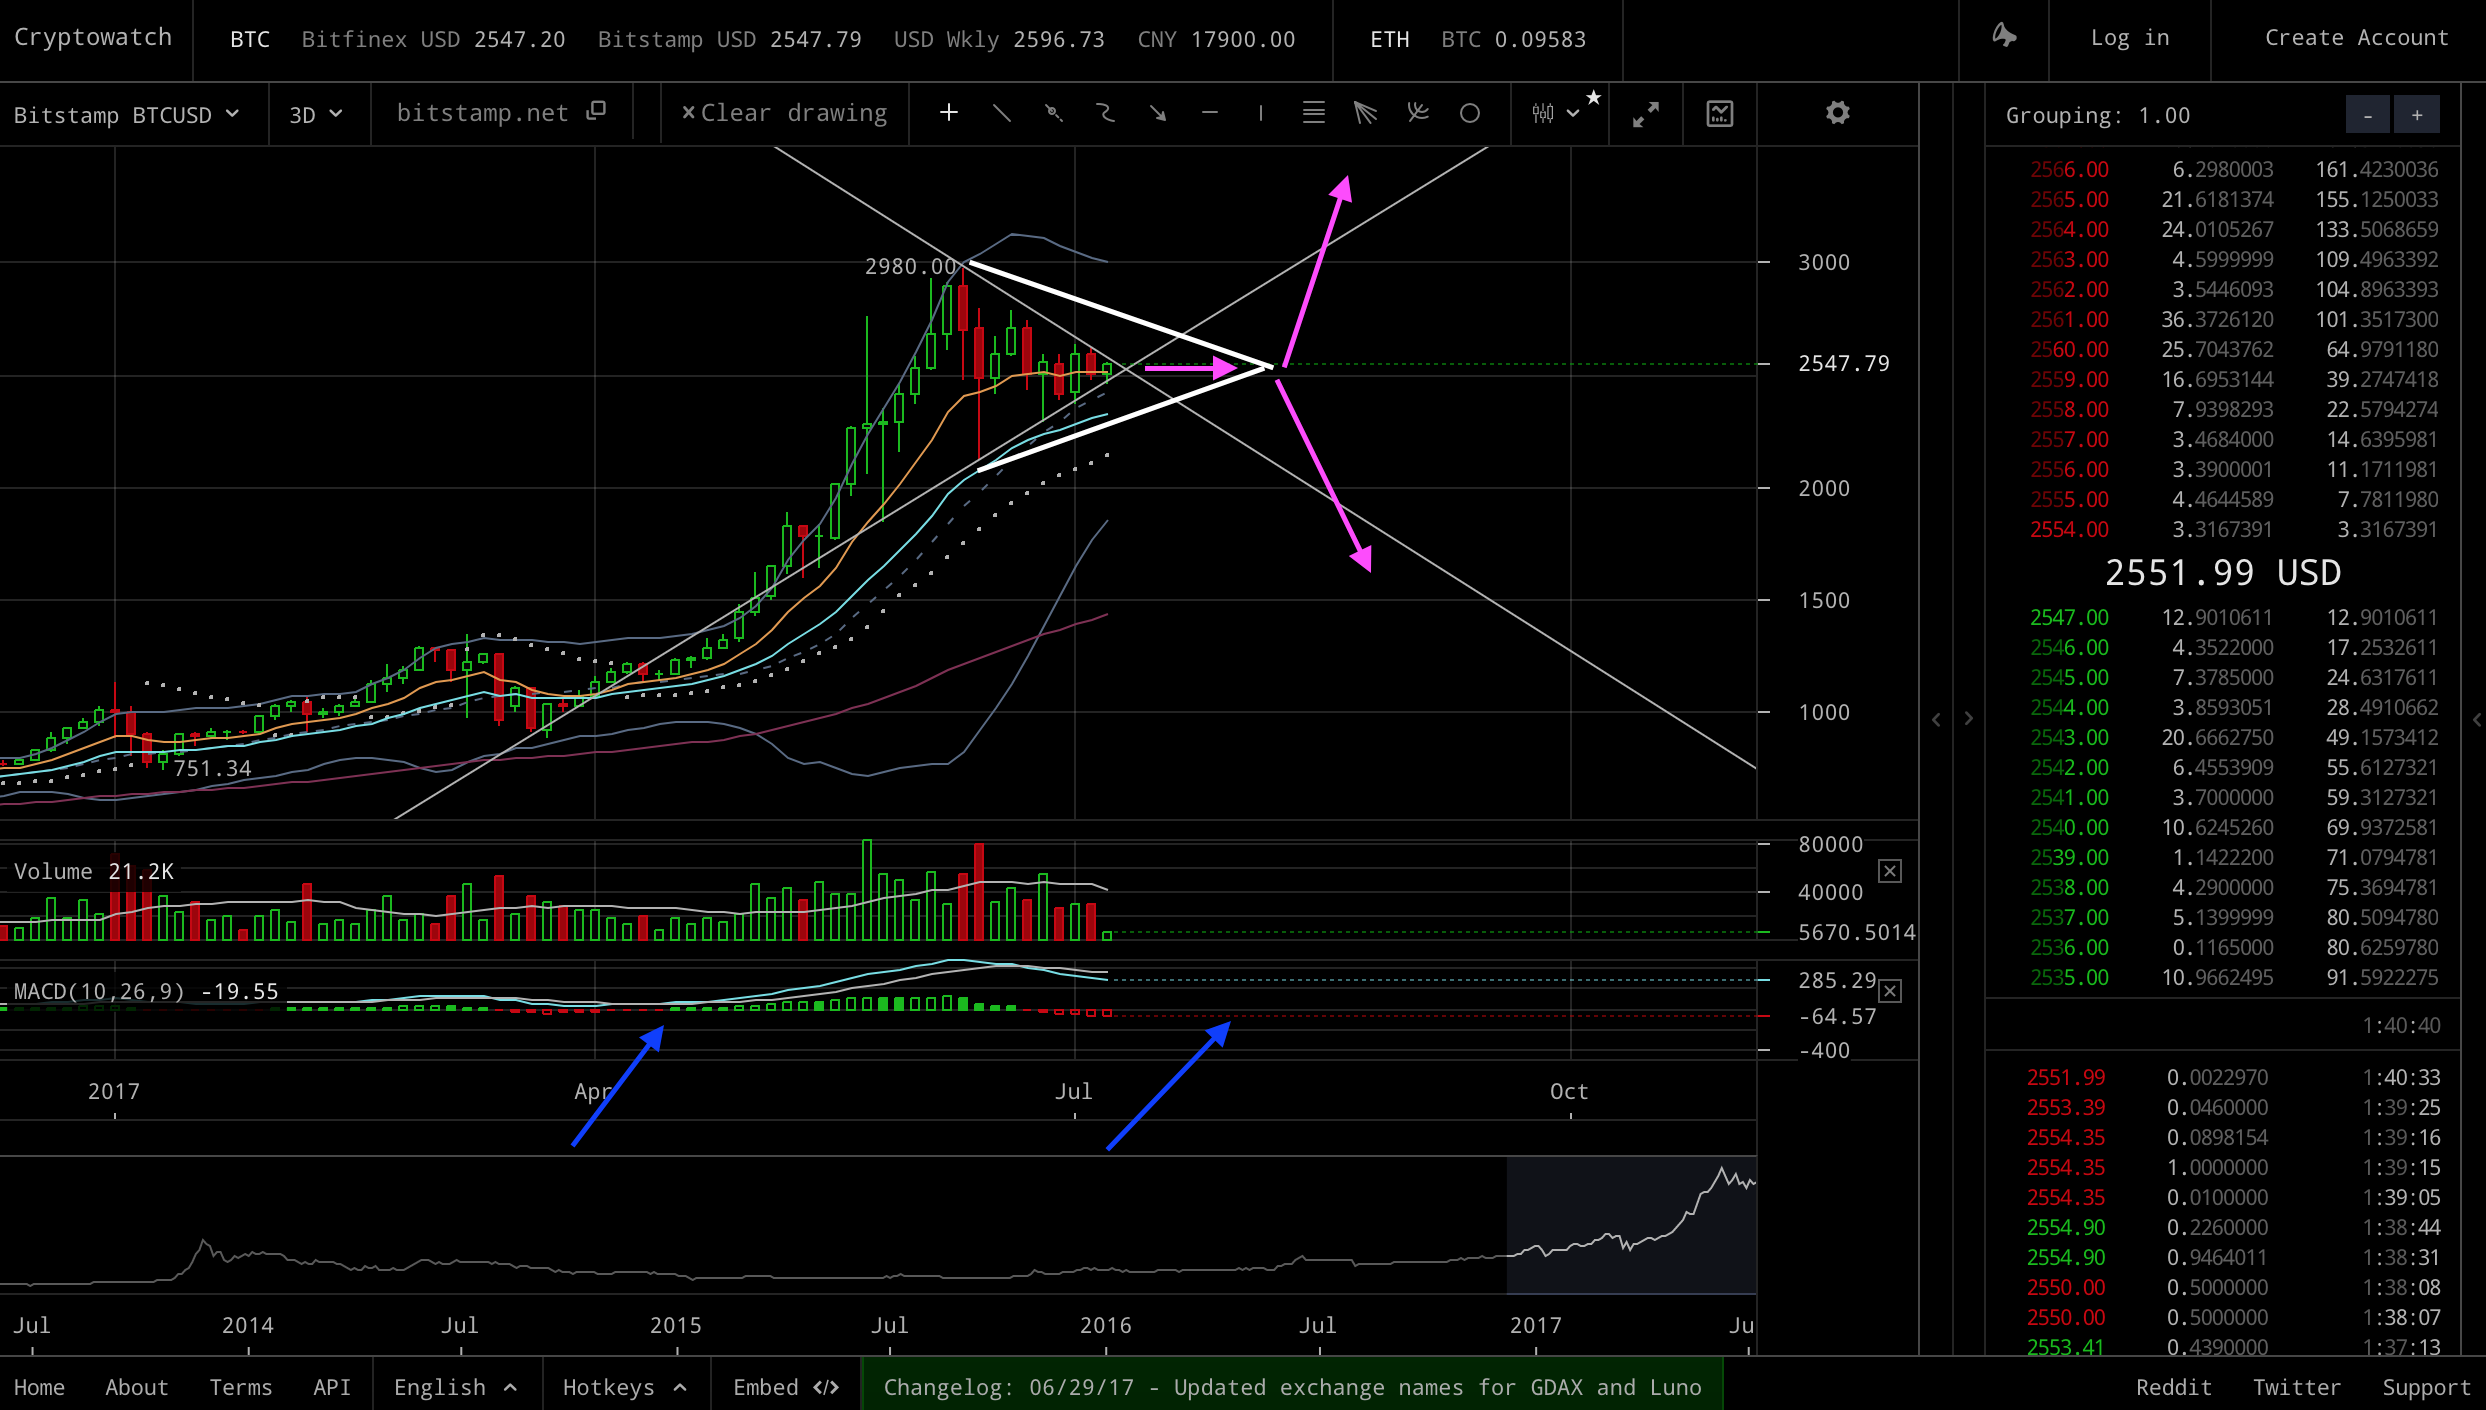
The following graph shows just such a triangle which has former during the current consolidation period (Bitstamp, 1-day chart):

To me, this graph is very exciting! This is because it looks like the current triangle is about to end very shortly - on this graph, by around 12th July. And, near to the end of such a triangle, there can be a great chance that a significant break upwards or break downwards may occur. I have shown these possible scenarios with the magenta arrows. I have also placed blue arrows at the previous and possibly next main MACD red->green switch-overs.
However, we are of course not guaranteed that a big break up or down will occur at the end of such a triangle. What might happen in the case we don't get one? We may get a smaller movement up or down, but not one that is significant enough to mean that the consolation period has finished. In this scenario it can be possible that we just get another triangle pattern forming, but with a resolution point that is a bit further away :)
The following graph shows this possible type of 'new triangle' scenario (Bitstamp, 3-day chart):

Again, i've used magenta arrows for the possible price movements. I've used a blue arrow for the main previous MACD red->green switch-over, and another one to indicate as a guess where we might see a next switch over. This MACD red->green switch over is a key indictor to look for, for a move upwards. As we can see from this chart, however, we're still in the 'red' zone, and a red->green switch over does not look that imminent - so this chart might point to an immediate significant break upwards being less likely than with the previous chart.
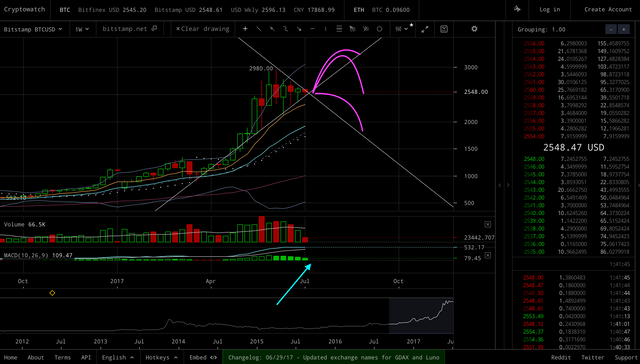
Next, let's look at the 1-week chart (Bitstamp, 1-week):

On this chart, we see that the MACD is still in the green zone. However, it's falling (shown by the cyan arrow), and this is not such as positive signal, because it might point to a green->red switch over in the not too distance future. But it's also possible that we could stay in the green zone for a long time with multiple 'bulges' occurring.
I've marked some possible scenarios for the price based on this chart with three magenta lines. The first one shows a rise, but because of the falling MACD, I would probably not expect it to be of the same magnitude as the previous recent rise (3x)(!) For example, a 1.5x increase from the most recent peek would take us to around $4500 (but I think that's perhaps pretty optimistic!). The next scenario shows the price increasing, but dropping right back down to where it started. This one would be consistent with the 'head and shoulders' formulation - but this is a negative indictor for what happens next, because that part is downwards, if the formation is correct! Finally i've drawn a third line for the case that the price just drops from where it is now.
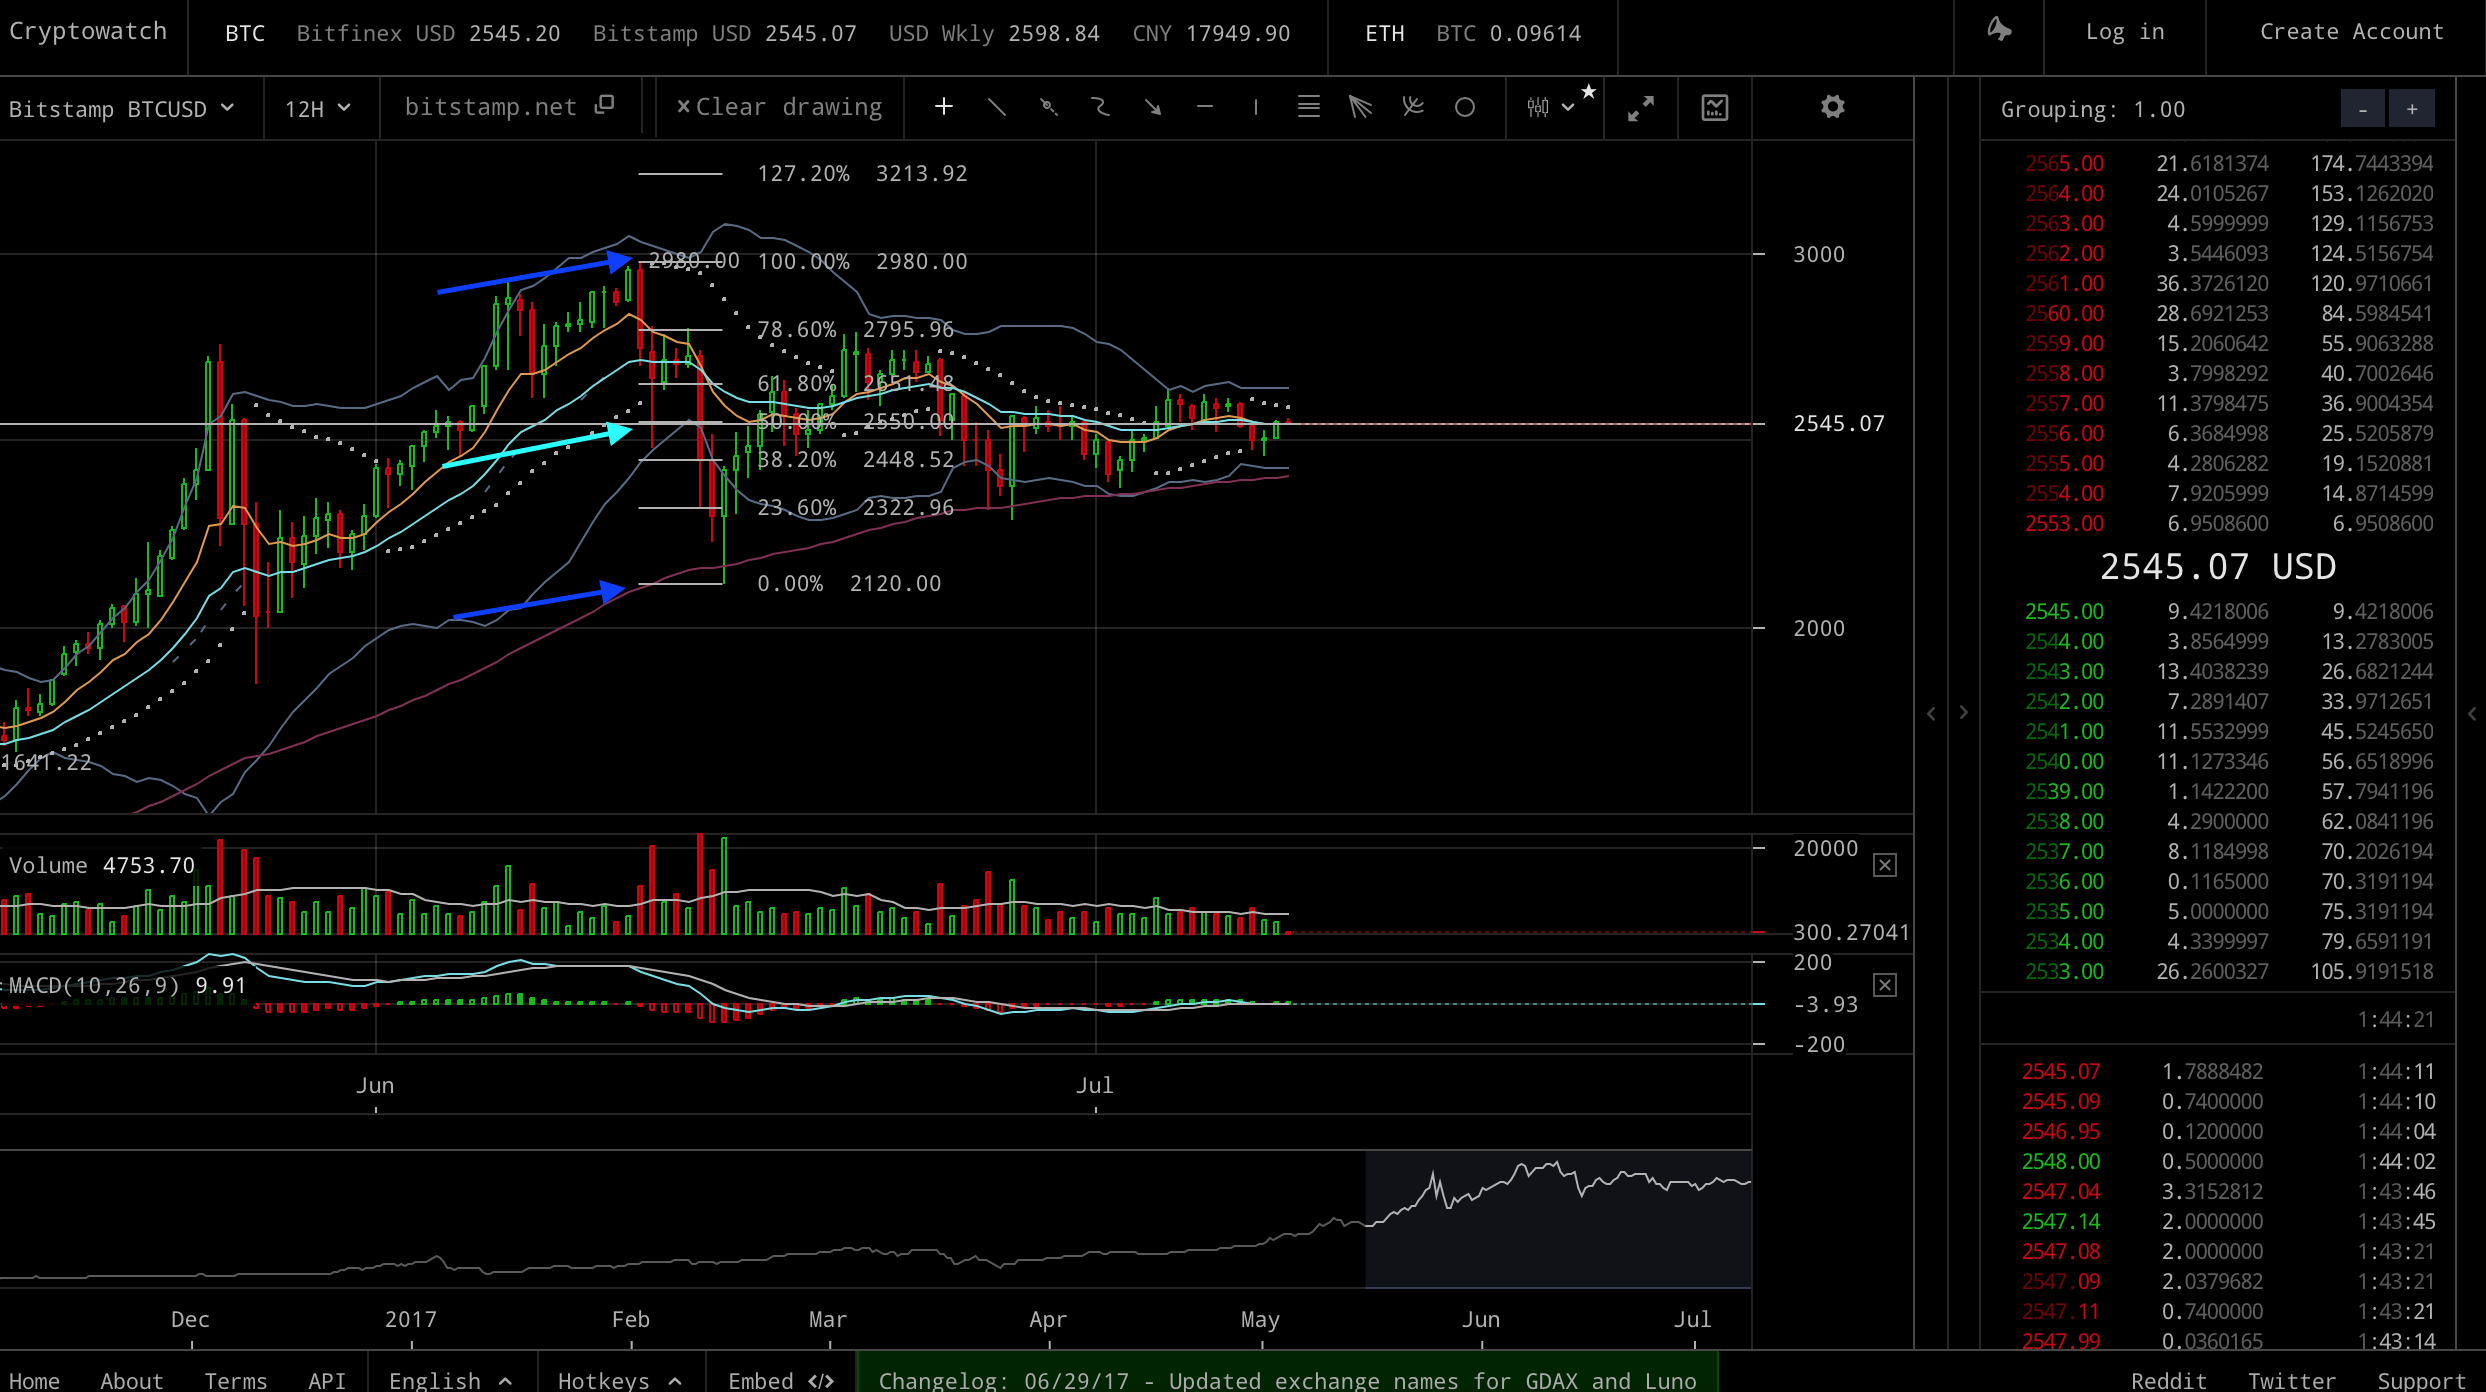
The next graph shows the Fibonacci retrace levels for the current consolidation period (Bitstamp, 12-hour chart):

I've marked blue arrows at the highest ($2980) and lowest ($2120) levels, and I've marked a cyan arrow at the mid-point (i.e., 50% re-trace) ($2550). Now, this chart is really absolutely amazing :) The reason why I say this, is that after the whole consolation period we have (just now) end up at just about exactly the mid-point between the recent top and bottom prices! Why is this so amazing? Well, to have made (a lot of) money during this consideration period, all you would have needed to have done would have been to have place buy orders between 2120 and 2550, and sell orders between 2550 and 2980. Or another way to do it would have been simply: buy when the price the price was below 2550 and sell when it was above 2550. This only works, of course until the consolidation period finishes, and it break up / break down (which I was discussing earlier) occurs!
My take on perhaps why we very frequently see these triangle formations and consolidation at the 50% retrace level, in bitcoin, is that many traders and automated trading systems predict this same pattern and therefore trade accordingly, which then gives the pattern a very high chance of being full-filling ;) It's easy money if you can just convince yourself these same patterns which have occurred in the past will happen the next time you're trading.
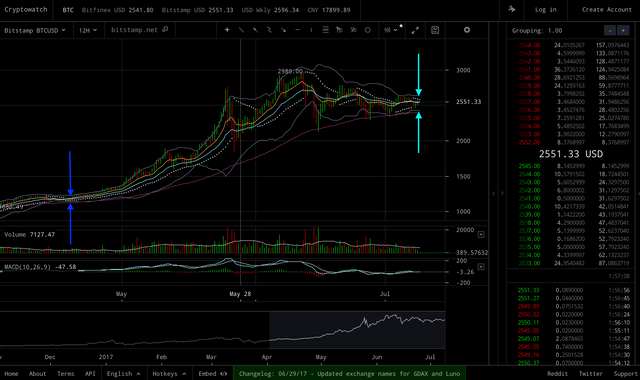
Finally, I'd like to quickly discuss the current Bollinger bands, shown in the following graph (12-hour Bitstamp chart):

As well as triangle patterns, MACD, and Fibonacci, Bollinger bands can be one of the most important indictors for a break-out (up or down). For my experience, the tighter the bands, and also sometimes the longer that they have had this tightness, the greater the movement will be when the break up/down occurs. Like with the MACD indictors, though, you need to decide which time-frame you think is going to serve as the best indictor.
On this graph, I've marked the B-Band separation at point which preceded the previous rise with blue arrows, and I've marked the current B-Band separation with cyan arrows. As can be seen, on this time frame the B-Bands have not currently tightened to the same level as they were before the previous rise (although perhaps I should be using a log chart for better accuracy here). A quick take on this might be: If we were to get a break out soon, then the magnitude might not be that great because we didn't start off from very tight B-bands; another take might be that it perhaps not unlikely that our consolidation period might continue longer.
So what's my trading plan? I intend to look for any a sign of a break upwards out of the current triangle, as we approach the end of it - and if i see it, I plan to buy some Bitcoin! In the case of a downward move, I probably won't be doing that much since I'm already sitting in more fiat that crypto, and shorting isn't really my thing. Instead, I would try just try to buy back in lower / try to catch the bottom of the correction (although this is never easy!) Overall, I guess my instinct is a bit towards the negative direction due the falling 1-week MACD, as well as possibly falling volume which I haven't discussed here - but, I'm still hoping for a rise!
Please let my know if you have any comments or suggestions for corrections to this post.
Thanks, and happy trading!
DISCLAIMER: The material in this post does not constitute any trading advice whatsoever. The reader should not make any trading decisions based on anything in this post, and must take completely responsibility for any trades they may decide to make after reading this post.
Nicely mined all the data great work and analysis of whole scenario
Many thanks!
Extra upvote for trump meme ;)
Hey @xaero1, excellent information! Really enjoyed reading this one. I see a lot of random speculation on prices so it's refreshing to study the technicals for me. I'm still a novice so I'm still trying to get the hang of using the MACD but I feel like every time I see someone using it, it clicks more. Haven't learned how to use the Bollinger bands yet. Anywhoo, it'll be fun to see what happens to the BTC price. I was actually thinking it might retrace below 2000 but it hasn't so far. When it breaks upwards $4-$5k range is totally possible but it might not even happen until fall/winter. But what do I know (nothing lol). Cheers, looking forward to reading more in the future.
Thanks a lot for your feedback and kind words!
My favourite site for charts is easily https://cryptowat.ch, which is simply amazing. In the settings, you can switch on loads of various indictors (most of which i know nothing about!) I just stick to a few, primary: EMA (exponential moving average), MACD, volume, and b-bands. For coins that aren't on there poloniex is good for charts although they are mostly plottted against BTC. I also use the coinmarketcap charts too.
I've got this vague feeling that bitcoin won't go up further until its shaken out all the possible sellers / 'weak hands'! ;) (disclaimer: I already sold most too!). This usually requires a 50% retrace at least, but possibly 63% is more likely. If so, we'd be looking at $1500 area for bargain prices ;). On the other hand, ethereum recently had a second 'leg up' from $200 area to $400 area', without a big retrace in between. So, anything is possible.
Best regards!
I think it will go green all.... as FORBES spread FUD :)
https://steemit.com/bitcoin/@hastla/btc-fud-from-forbes
Thanks for linking that. Good read... but I don't think it's completely FUD e.g. It says "When some of the dozens of cryptocurrency schemes crash, there will be pain. However, the long-term impact on our economy of these experiments will be positive.". Also, In markets like this i tend to think prediction articles like this have little impact: At the end of day, the market will go exactly where it wants to go whether that's up or down.
nice stats.. Need more of this great analysis.. its gonna be helpful to me and all newbies in crypto world. Resteemed and followed
Thanks very much! Once this triangle completes I think the EMA (exponential moving average) indicators will be more important, so I'll hopefully make a post about that.
I like your chart reporting. Alongside with many other comments I agree we should also be taking into account the general sentiments about the coin.
My suspicion is people are holding tight until after August 1st...I think the charts would agree with that. Depending on the outcome of the upgrade, the price will either soar or drop.
We will all see soon enough :)
Interesting to hear that many comments to this post that I read so far have mentioned this issue, while I'm pretty much ignoring it :) I guess maybe that's because I'm mostly just trading BTC these days rather than holding it - the things I am holding long term are SP as well quite a lot of ERC20 tokens. But, yes- we will see very soon!! Thanks for your comment :)
It's nice to hear your openness to suggestions. IMHO technical analysis is important and works well within the traditional markets - but cryptos are such a different animal and move so quickly with changes in sentiment, FOMO and FUD - it's good to include these external factors in any analysis :)
Looking forward to reading your future posts :)
Thanks for very much for your reply.
But in my experience I'd say crypto is easily the best suited type of asset, that I know of, for use of technical analysis. This is because I see the main factors in how cryptos behave as being like 'crowd movement' or waves hitting a beach. The patterns are regular and repeating. Whereas with stocks, quarterly reports about profits etc are a key driver of price; with bitcoin there are no earnings/dividends to affect the market-analyst's valuations (in fact im not sure there's any real way to price what a currency-type crypto should be worth?...its all just about supply and demand! :) )
Love this! I wish you'd post more analysis as such, though to be honest I've captured only about 80% of this post haha. But I got the overall picture.
12th July... About two days! I have to manage my crypto fund now and be ready!
This will be my homework- learn more on different indicators! Hopefully by the time you post the next one, I can grasp it 100%. Or at least 81% will do haha.
Resteeming, mainly for my personal reference ^_^
Much appreciated - thanks :D
Will try to post something about EMA (probably the most important indicator of all), next. It would just be nice if I could post it before BTC crashes down if it were to do this ;)
Before BTC crashes- about 2 days! Lol. Wait I havent checked maybe you already have the EMA post up. Lol.
Haha.... that was my fear. And yes, today was pretty much a bloodbath (although much more for alt coins).
But yeah, watching the prices fall is a bit of a demotivating factor for me, for making a post!
Actually, I was going to make an 'ironic' meme post ... but then though I better not as people could take it literally ;)
And yes, the 1-day EMA has crossed over in the negative direction (https://cryptowat.ch/bitfinex/btcusd, switch on EMA and observe that the moving averages have just crossed over).
Oh well, it least it means I can possibly take a holiday and come back in a few weeks/months when the market might just be ready for buying back in, somewhat.
Very simple..super great
@xaero
This is was actually/easily my best post ;D
i believe there may be a drop at the price but it will raise and start to shoot to the moon again.. when it drops i am going to back more bitcoin.
I think that's probably the most likely outcome too, and that's my plan as well :)
Congratulations! This post has been upvoted from the communal account, @minnowsupport, by stan451 from the Minnow Support Project. It's a witness project run by aggroed, ausbitbank, teamsteem, theprophet0, and someguy123. The goal is to help Steemit grow by supporting Minnows and creating a social network. Please find us in the Peace, Abundance, and Liberty Network (PALnet) Discord Channel. It's a completely public and open space to all members of the Steemit community who voluntarily choose to be there.
If you like what we're doing please upvote this comment so we can continue to build the community account that's supporting all members.
You have posted great insight with different TA tools, and to most extent i am agree with your graphs, but these are for normal arket periods, right now we are expecting Sexwit2X which has already failed multiple times, when devs tried to implement it, dont you think impact of that news is too heavy on the bitcoin and everything right now is revolving around that decision?
Thanks very much.
On sw: Personally, if I was holding much bitcoin i don't think i'd be hugely worried right now because i think it will resolve itself one way or another. I.e., either we don't get a split or else one chain will be dominant and other one will be largely ignored. I think there's a lot of 'brinkmanship' from both side .... but, just as with what happening with Litecoin, it all got resolved. However, I wouldn't be surprised if we got a drop if the problem hadn't be resolved by Aug 1st...but often when there's a panic induced drop, it just bounces straight back up to where it was before :)
Yeh that is what think will happen, in short run BTC will drop and touch a level of 1500-1800, and in long run, no one needs my opinion, every one knows 🚀 🚀
Shall we worry?
It depends where your goals are.
If them are 2 weeks, 1 month, 3 month ahead - then worry. Analyse. Trade. Take the risks.
But...if you goals are 3-5 years ahead ( or more), then
Relax. Do nothing. Watch the drama. Enjoy it.
P.S.
That's what I do
My article was intended for those interested in trading. If you're just holding, that's great. Long term I believe the trend is very likely still to be upwards, and that bitcoin will be worth more as each 'halving' occurs.
Fully agree
you're absolutely right. Just hold and chill.