Bitcoin Price Prediction March 2018
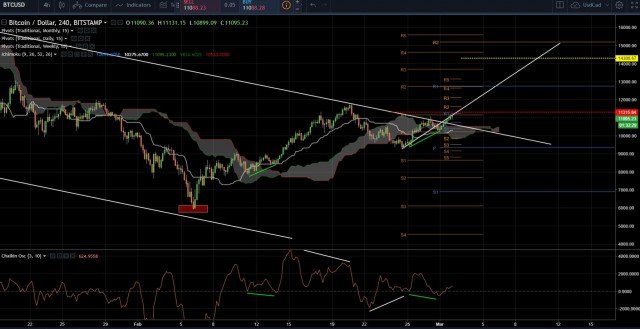
Currently Bitcoin is trading above a longer term channel, which at this point looks like a valid breakout attempt. We can see both bullish divergence on the oscillator at the bottom of the chart and hidden bullish divergence. This is the 4 hour timeframe chart.
If this takes off then how far could it go before we see a deeper correction and profittaking?
One way to estimate that is to simply draw a line between the 5920 low and the current high, then move that line to the recent low. This creates a harmonic AB=CD pattern. The first "leg" is the AB leg and the next (the projection) is the CD leg. If we do that we can see price reach $15 200 by March 12. Now, this is the ideal and perfectly harmonic move of the CD leg. In my experience, it can be a very useful and valid way of placing targets.
The second way is to look at divergence. This is a method I can use as an alternative, which tends to give a more modest target, but still, it is a good gauge of the "power" of the Bulls. I will look at hidden bullish divergence. On the chart below, which you have to click to enlarge, to be able to see the details of it, the hidden bullish divergence is marked with green lines both on the osciallator at the bottom and on the price chart. The first HBD resulted in a move of exactly $3000. If we project the same distance from the current bottom, which is the second HBD, it will result in a move to the yellow line in the price chart, which is $14 300.
But what if price exceeds the first target at $15 200? A move beyond the D level in an ABCD pattern tends to happen when the move is sharper, which in this instance would mean that price reach the D level before March 12. Then what you do is that you draw the fibonnaci levels between the C and the D point, so that you have the 1.272 and the 1.618 extension points drawn. This will be the next targets above the D level.
In the chart below I also keep the pivot points of Daily, Weekly and Monthly. They are not necessary, but when you have a projection target, using any of the two methods above, that aligns with a higher timeframe Pivot (Weekly/Monthly & Yearly) it will add resistance to that particular target level. In this instance we saw that the D level aligned perfectly with the Monthly R2, which makes that level a much stronger resistance (so called confluence resistance).
So, I hope you learnt something from this that could add to your technical tool box.

Cool Post. Since you got the bitcoin tag do you have a prediction for Bitcoin over the next few days? Also followed you for future posts :)
Thanks, A H4 close above 11300 may take price to 12750 which will likely reject price at first test. A close below 10450 and we are looking lower.
Congratulations @wothancryptoeye! You received a personal award!
Click here to view your Board
Do not miss the last post from @steemitboard:
Congratulations @wothancryptoeye! You received a personal award!
You can view your badges on your Steem Board and compare to others on the Steem Ranking
Vote for @Steemitboard as a witness to get one more award and increased upvotes!