BTC neck
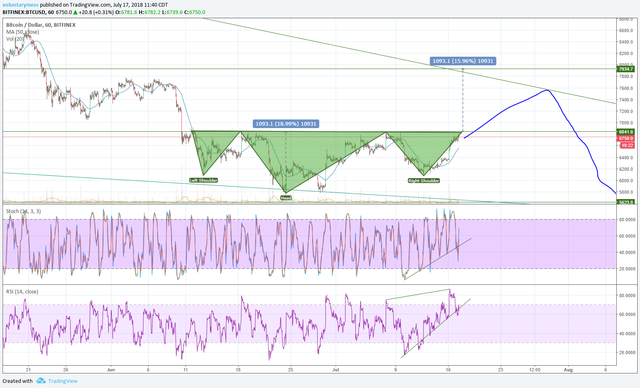
All eyes are on the low timeframe BTC charts. Everyone is waiting for confirmation of a neck-line break of the inverse head & shoulders pattern formed over the last month which would be a bullish signal for traders. Volume appears to be heating up and a break of the neck line could send us up to the next technical level.
Price action and volume are far-and-away the most important indicators and so far we're on track to complete this pattern, but while we hang in the balance it's good to take a spin through a few indicators and see what story they have to tell. I've posted a chart with RSI and Stoch and you may notice something a tad alarming if you were banking on the neckline-break confirmation of the iH&S. Check the RSI trendline breakdown and re-test as resistance. Additionally, if price action fails to achieve a swing high above 6840, it's very likely bearish divergence will form which could signal a break downwards.

I'm sticking to my guns of a bull-trap up to the wedge resistance followed by a break-down to the 786 fib support and ultimately down to 3500. If the iH&S confirms, traditional trading rules would suggest a run of ~1100 which corresponds to the approximate 'height' of the pattern as measured from neckline to the head. This would put the target right around the channel line of the falling wedge and a great place to take profit and potentially go short.
I haven't seen enough evidence to change my trading plan, but if this iH&S fails to confirm it could change the plan quite a bit. It's a big 24 hours.
Keep two hands on the wheel fam.