BTC bullish box
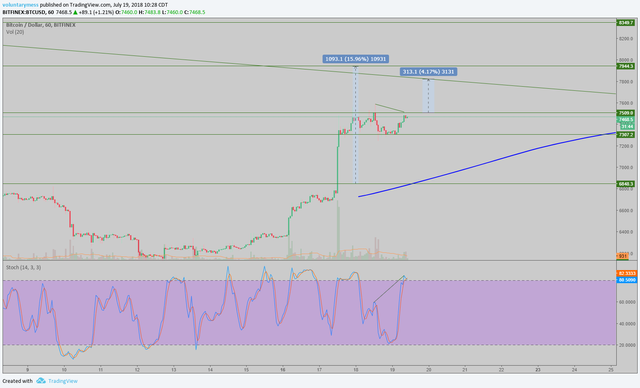
Recently we saw bitcoin break the neckline of an inverse head & shoulders pattern which would (by traditional trading rules) predict an upward movement from the neckline of approximately 1100 points - measured by the depth of the pattern from the top of the head to the neckline.
If my prior 'big picture' article is correct, this would roughly coincide with the final rally before diving down to the 786 fib support level at ~5600. Again referring to a prior article, remember that if this market cycle is similar to the 2013 market cycle, bitcoin price will return to 786 fib support before quickly plunging ~40% and marking the bottom, thus completing the cycle.
Changing back to the hourly time frame, bitcoin appears to be taking a breather after a blistering run on Tuesday. Though it's a tad sloppy, the price action is in a consolidation pattern half-way to our ultimate target of 7900. Because I believe that we're closing in on a much bigger leg down, I will be waiting for confirmation of a breakout upwards rather than trying to grab every last pip along the way from an overly-aggressive entry.

If you're looking to get cheeky, it looks like there's bear div forming on the hourly - a possible indication that there is one more bounce off the bottom of the box scheduled before the next rally.
If price breaks upward out of the box, I will be scaling out of the long position rather quickly and securing profits rather than getting caught on the wrong side of the trade. Night is darkest just before dawn... and I believe the sun will rise in September.