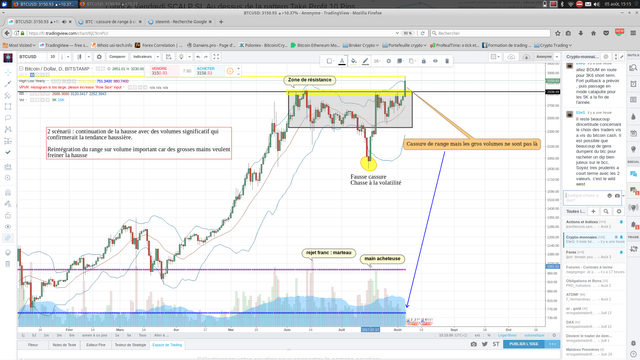
Bitcoin look like a rocket or not ? Chart analysis (French annotation)
Hi Steemit community, How are you ?
I think you have view the great daily evolution of bitcoin but let's see what really happen on the graph, which are the expectation, are we really in a uptrend ?
The annotation in the graph is in french.
Fundamentally, I have a bullish expectation on bitcoin, I believe in block chain!

We were in a range, we saw a false breakout in the middle of july, it look like a correction and a opportunity to buy for big arm.
2950-3000 $ is a key resistance point, there was a double top on this level.
After, the false breakout we return to the range.
If we look at the volume :
The 15th june, there was beautiful candle of bearish rejection with volume --> Big arm rejected the bearish trend.
Mid-july : there was big volume and big bullish candle so buyer take the lead.
Today there are the rangebreakout, I think the bullish trend restart but be carrefull there are not significant volumes so for me the bullish trend is not confirmed!
2 scenarii :
-Big hand enter on bitcoin with significant volume and confirmed the up trend !
-Big hand enter on bitcoin with the expectative to return to the range !
Take your profit if you think we can return to the range
Buy bitcoin if yu think it's the begining of a up trend
Have a nice week end
rocket
a 4000 $ rocket
i just upvote .. how it work !!
Congratulations @vincentregnault! You have received a personal award!
Click on the badge to view your Board of Honor.
Do not miss the last post from @steemitboard!
Participate in the SteemitBoard World Cup Contest!
Collect World Cup badges and win free SBD
Support the Gold Sponsors of the contest: @good-karma and @lukestokes
Congratulations @vincentregnault! You received a personal award!
You can view your badges on your Steem Board and compare to others on the Steem Ranking
Vote for @Steemitboard as a witness to get one more award and increased upvotes!