Bitcoin future analysis what will happen ? Back Above $6K: Bitcoin's Bull Reversal Is a Work in Progress..!

Bitcoin (BTC) has regained poise over the weekend after a drop below $6,000 last week, but a short-term bullish reversal is still not confirmed.
At press time, the leading cryptocurrency is trading at $6,320 on Bitfinex – up 13 percent from the seven-month low of $5,755 hit on June 24.
BTC was expected to remain on the defensive and drop to fresh 2018 lows below $5,755 over the weekend, having closed below $6,000 (February low) on Thursday.
However, it unexpectedly picked up a bid at $5,780 on Friday, contradicting the bearish technical setup, and rose to $6,545 on Bitfinex on Saturday – its highest level since June 22.
The bounce may be due to sellers running dry, having pushed BTC lower by 70 percent in the first six months of the year.
Further, the repeated rebound from sub-$6,000 levels (February low) have established the area below the psychological mark as a significant near-term support.
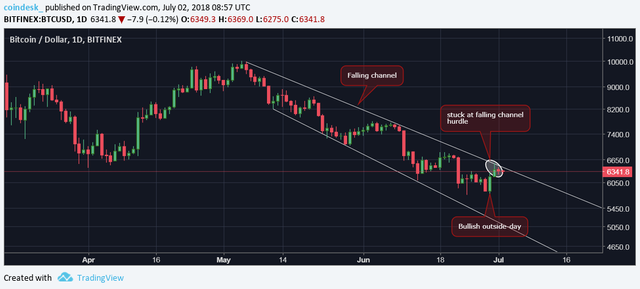
Still, it is too early to call a short-term bearish-to-bullish trend change, as the bulls are yet to violate the series of lower price highs and lower price lows, as represented by the falling channel (bearish setup) seen in the chart below.
Daily Charts-
BTC created a bullish outside-day candle on Friday and closed (as per UTC) well above $6,302 (Friday's high) on Saturday, confirming a bullish outside-day reversal pattern.
However, the follow-through has stalled at the falling channel resistance in the last 48 hours. Hence, we remain cautious and would feel comfortable calling a short-term bearish-to-bullish trend change only after BTC has crossed the falling channel hurdle in a convincing manner.
That said, the probability of an aggressive move above the falling channel resistance, currently located at $6,450, looks high as the cryptocurrency has created a bull flag – a bullish continuation pattern – on the short duration chart below.
Hourly Chart-

A break above the flag resistance of $6,416 would signal a continuation of the rally from the recent lows below $5,800, and would open the doors to $7,065 (target as per the measured height method, i.e. pole height added to breakout price).
View
The sell-off from the May 21 high of $9,990 seems to have ended. However, only a bullish falling channel breakout would confirm a short-term bearish-to-bullish trend change.
Should BTC cross the falling channel resistance of $6,450, then resistance lined up at $6,848 (June 19 high) and $7,000 (psychological hurdle) will likely come into play.
On the downside, a break below $6,000 would kill the odds of a short-term bullish reversal.
A daily close below $5,755 would revive the bearish outlook and expose support at $5,400 (Nov. 12 low).