Bitcoin cash : price analysis
BTS/USD:
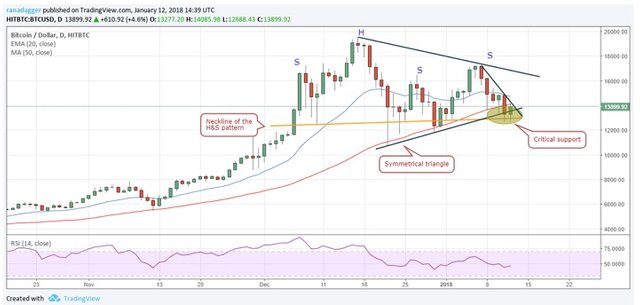
Bitcoin broke below the 50-day SMA on Jan. 11 and since then, it has been struggling to climb above it. It has managed to hold on to the critical support level between the trendline of the symmetrical triangle and the neckline of the head and shoulders pattern.

If Bitcoin fails to rally within the next two days, chances are that it will turn down and break below $12,500, sinking it to $8,000 levels.
On the other hand, if the cryptocurrency clings on to the support and moves above the 20-day EMA, it will indicate a short-term bottom.
Very aggressive traders can buy on a breakout above $14,500 and keep a stop loss of $12,500. The target objective of this trade is $16,500. This is a very risky trade, hence, should be attempted with only 25 percent of the usual position size.
Risk-averse traders should wait for a reliable setup to form as there is no clear trend on the BTC/USD pair as long as it trades inside the triangle. It’s better to wait for a breakout or breakdown from the triangle before initiating any positions.
loving the analysis, thank you man!!
Mention not bro just spread this news :)
haha upvoted ;D
Thanks man