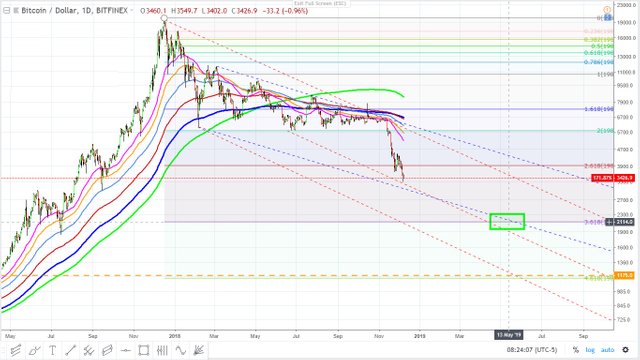
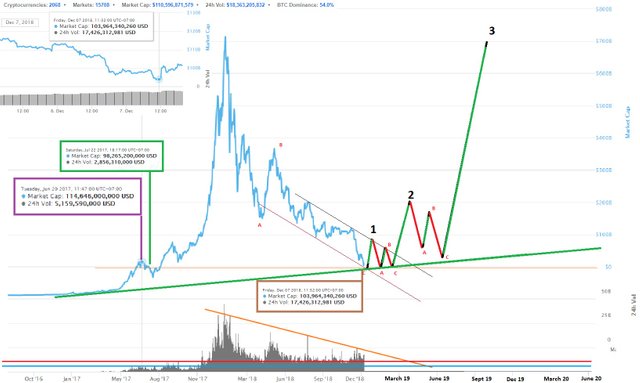
Bitcoin Broke Down From 2.618
Bitcoin's next Fibonacci level is 3.618 times the A wave. Looks like it will tag that around the second quarter 2019.
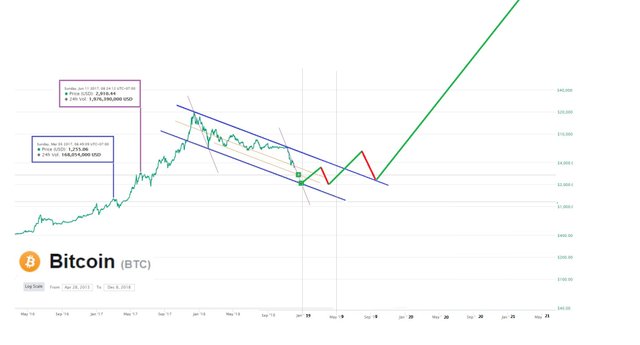
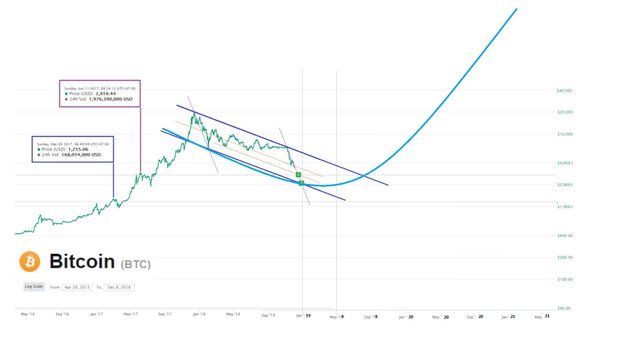
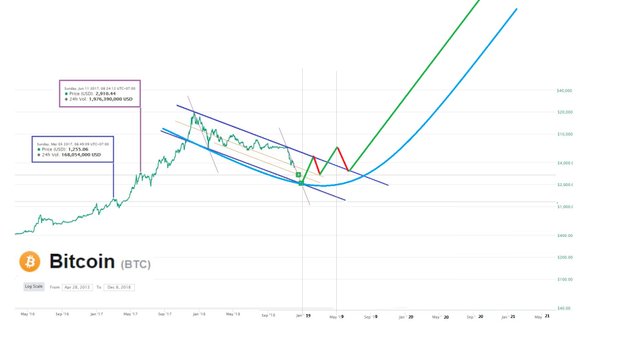
Channels don't necessarily need the price to tag the support line all the time so the price could meet the median line and then take off to the upside.
As it stands right now the price should tag the 3.618 times wave A
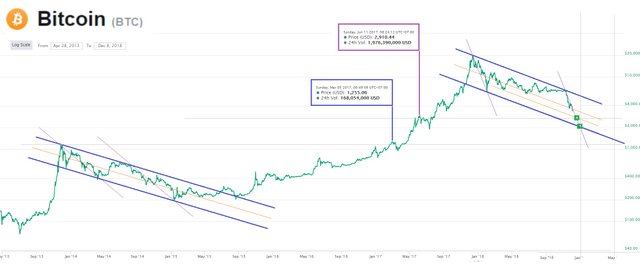
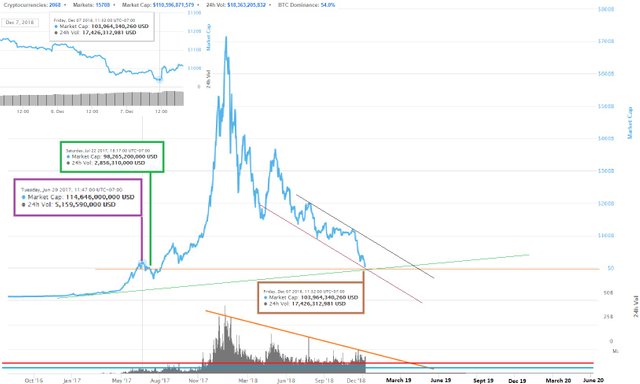
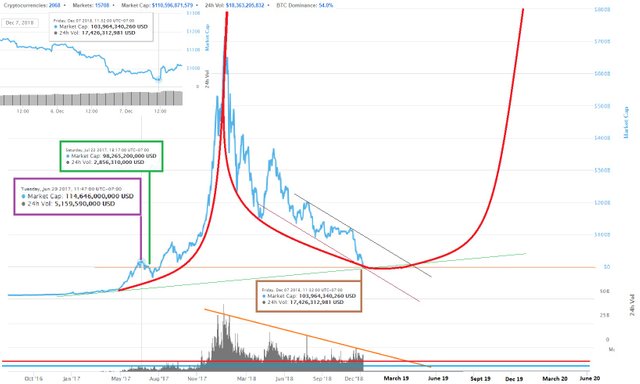
- The other charts below are of the total market cap. Indicating the price is almost at the ascending support line and the price is around the consolidation around June 2017.

All data and information provided is for informational purposes only. Trend Wizard makes no representations as to accuracy, completeness, currentness, suitability, or validity of any information in this post and will not be liable for any errors, omissions, or delays in this information or any losses, injuries, or damages arising from its display or use. All information is provided on an as-is basis. I document this stuff for personal reasons as a log and share with the community...... only because I'm a nice person.
So in ending........ Use critical thinking and think for yourself.
@trendwizard i think you are good in TA.
Do you trade leverage on BitMEX ??
No I don't trade leverage. I'll take a position in an option every now and then. Other than that I try to make only about 2 trades a year in something. Just swinging from trade to trade. It's really quite boring.