RE: NEO/USD Could Get a Buy Signal while NEO/BTC corrects.
Haejin, I think your viewers might benefit from a more step-by-step description of what each of these charts suggest. Let's open up a conversation.
The NEO/USD chart seems to contradict the NEO/BTC chart i.e. the MACD suggests there will be a bullish cross soon for NEO/USD while, on the other hand, the MACD suggests a bearish cross has already occured for NEO/BTC.
What does this mean?
For me, this analysis could mean 2 things.
The demand for NEO will increase in the coming weeks (causing NEO/USD to rise), but will be outstripped by the demand for BTC (causing NEO/BTC to fall). This goes along with the current price action we are seeing in BTC that many are saying will push BTC to 14k.
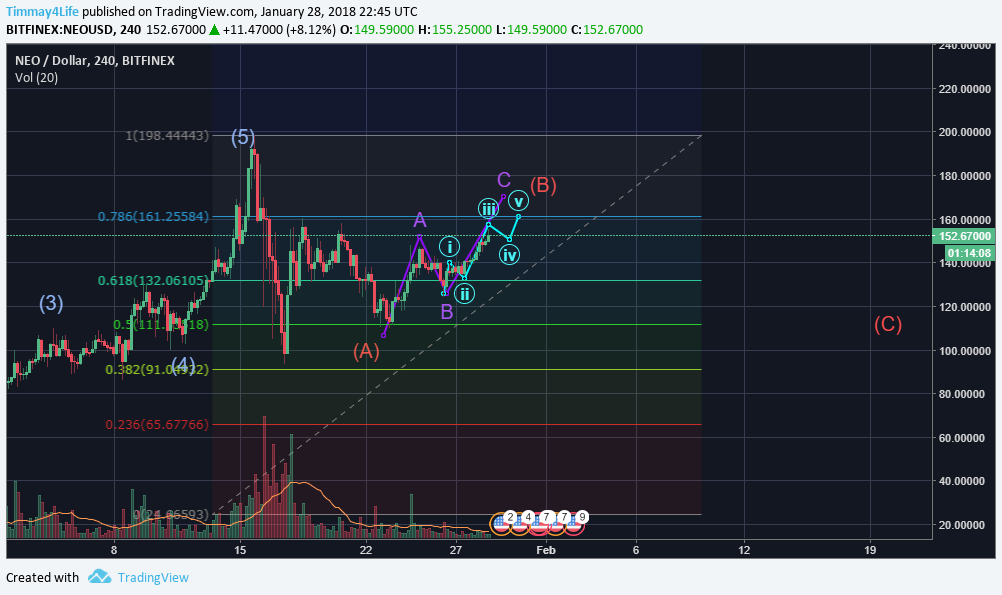
Because the MACD for NEO/USD is curling up but is yet to cross, there is the possibility that the cross does not actually occur and demand for NEO continues to fall (pushing NEO/USD lower...not immediately but over the coming weeks). This scenario also allows for BTC to 14k and agrees with the NEO/BTC chart. This seems more likely to me, considering NEO looks to have just finished an impulse of intermediate scale and could be mid-B wave of the corrective retracement. I've offered my analysis for the short-term below. This scenario could gain credence if the total crypto market cap follows the head and shoulders pattern that you suggested in a post earlier today.
In conclusion, if Haejin's analysis proves to be correct, now may be a good time to ladder in and get ready for the ride. However, I have greater reason to be cautious at the moment, and think now may not be the right time.
Of course, I am very new to all of this and still learning, so I welcome anyone to join in on the conversation and point out where I missed something. Heck, I may be completely wrong. But in the end, no one knows exactly where the charts will take us next. Only time will tell(:
Great discussion of "what does this mean". You may be able to carve out a niche by doing this for all of haejin's posts...
I think it is good to keep yourself accountable in this game of TA so that we can really see if we are on the right track or not.
According to the short-term outlook I proposed 9 longggg days ago, NEO looked to top out around $160 and proceed with the correctionary wave C. Indeed, this is what seems to have happened, with a top of $169 and (tentative) bottom at $63, a precision hit on the 0.236 fib retracement from the rally starting mid-november. (see updated chart)
Although my price prediction seems to have been correct, the reasoning I gave was almost completely wrong! The MACD did end up scraping but not crossing. However, BTC did not go to 14k as I was assuming...it actually went to 6k!! Very humbling indeed!
So where does NEO go from here? Could this be the start of the B wave of a 3, 5, 3 correction? Maybe. Is the correction already all done? Possibly, but that means it would have completed unusually fast. Then again, crypto is usually unusual! And that's why it's exciting! So let's see where the price takes us next(:
The contradiction seems because the NEO/USD has only variable (demand for the coin) while the NEO/BTC has two variables (demand for the coin plus change rate of BTC). IF BTC declines, to a certain degree the NEO/BTC rises and vice versa. The analysis shows NEO/USD could rise along with BTC.