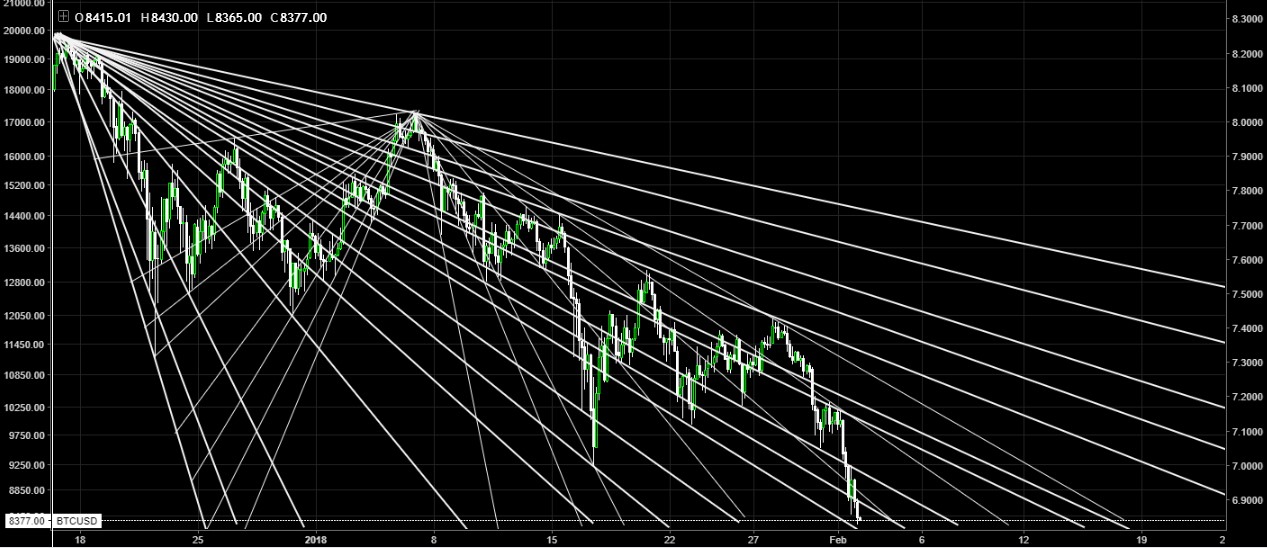
BTC/USD UPDATE 01/02/2018 Multiframe analysis
FIRST AND MOST IMPORTANT
To the majority who post and chart in tags how bitcoin, btc, trading, cryptocurrencies, crypto, altcoins, money and have a reputation based on what parameters (since I am new) to them I want to tell you certain things without the purpose to offend, but to help them and warn them:
Study, read (I can recommend certain books and LEGIT traders to follow)
Keep in mind that there are people who are following you depositing not only your trust in all of you,
they also put their money at stake.
It's useless if you do post that are for daytrading and calls the next day they disintegrate.But I know they do it to be active, make money and make 10 per day, collect average usd 500.- for each one (which I congratulate and we know that whales, sea lions or animals of "great size" are talking and I will not name them because I have codes)
but I must remark again the previous paragraph.
If you know trading, you know that making a chart of a small TF (time frame) gives you a lowercase perspective, a picture of the moment, it can even give you false signals, more in the case of the BTC.
You are looking at the tree, not the forest.
If you want to collect and will do short-term analysis or for people who have a lot of experience in daytrading, swing, scalp: post and clarify that it is not for anyone. And if you want to raise, do medium-term analysis but different currencies.
END
BTC / USD 02/01/2018
I will perform a 100% TA analysis, leaving aside any fundamental that weighs in the price.
If they see well I will use graphics that are in previous posts.
BTC / USD Bitstamp TF Daily
Global chart
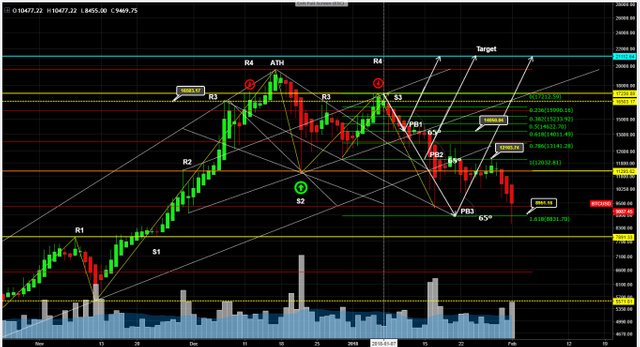
Zoom: http://prntscr.com/i8w0lo
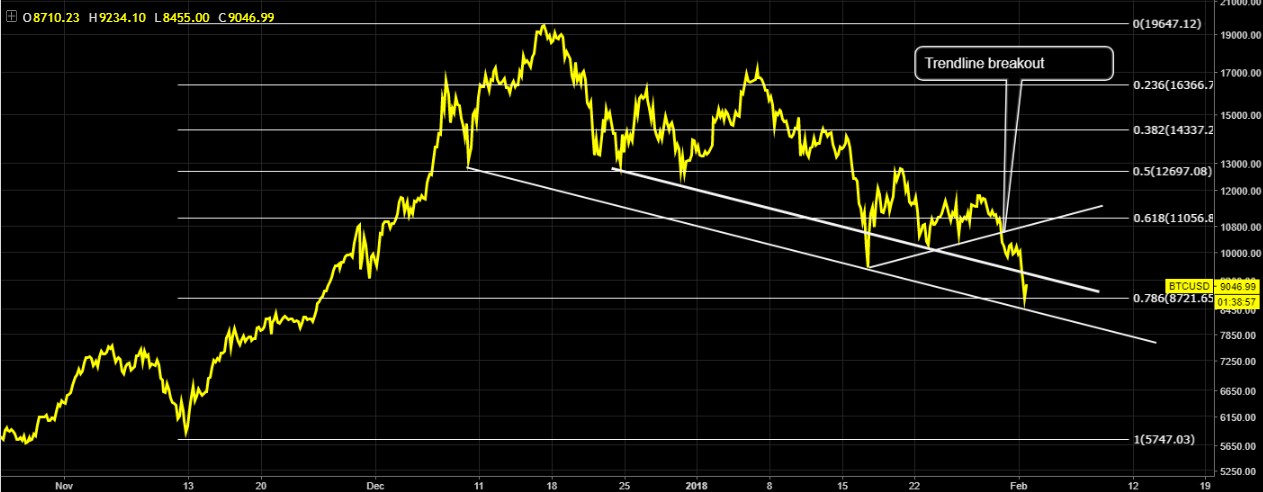
Zoom :http://prntscr.com/i8w1u6
If you see both charts the price of the BTC (in the global drilled the line its last minimum but has a shadow, wick) that does not confirm this yet.
Why? because it is losing strength and when dealing with daily candles, we will only see it reflected when they finish 24 hours. That is in 2 hours.
On the other hand, in the graph represented by the yellow line, although it did not stop at the level of greater importance of FIBO and if in the line that I drew, we are in the presence of a pullback.
For now small and may even be a spasm, for having touched a psychological level how was the previous HL.
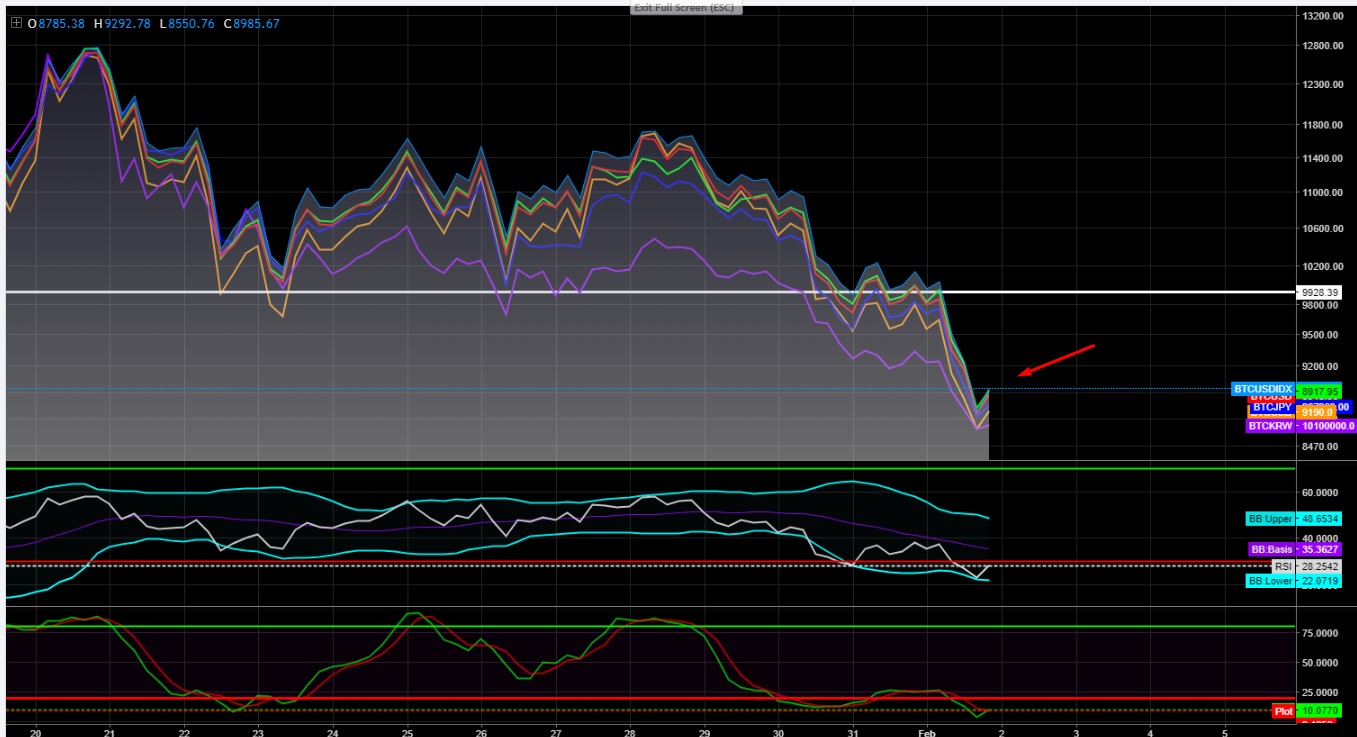
BTC Global signal
We will see what information gives us, my BTC signal which I already told how it worked in a previous post if they want to see.
Zoom: On the other hand, in the graph represented by the yellow line, although it did not stop at the level of greater importance of FIBO and if in the line that I drew, we are in the presence of a pullback.
For now small and may even be a spasm, for having touched a psychological level how was the previous HL.
BTC Global signal
We will see what information gives us, my BTC signal which I already told how it worked in a previous post if they want to see.

Zoom: http://prntscr.com/i8w70n
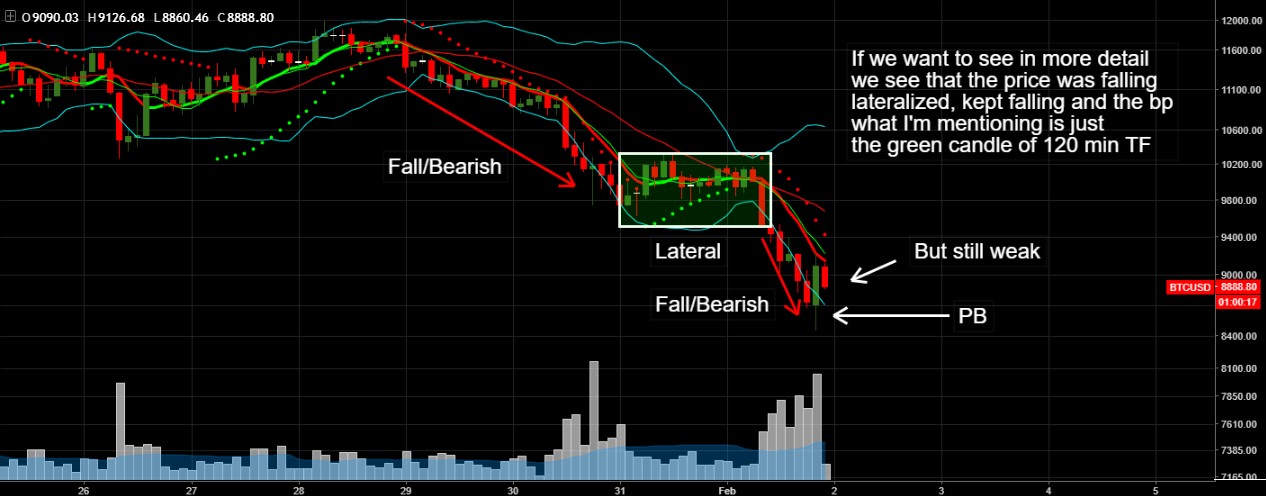
Zoom: http://prntscr.com/i8wbwj
He performed a small pullback, typical behavior when he plays a psychological weight value.
According to my humble opinion I see a weak BTC trying to find a reference floor. For many factors, which are fundamental, candle reading denotes a battle between bears / bulls that bears are winning in the short term.
Lateralize or follow bearish.
I'm going to give you a more detailed analysis, but all the information I passed on you is happening exactly now.
Thanks for reading and see you in a while!


As I mentioned in the post: The BTC is going to retest the level where it did pullback.
Zoom:
Next challenge: resistance critical level 8.6/8.5K
After that we would enter an area of concern.
@hendrikdegrote
@hr1
@pharesim
@liberosist
@curie
@roelandp
@bue
@rbreauxfl
USD 8.343,99 02/02/2018 5:05 AM
