27 Oct 18 - Bitcoin Snapshot
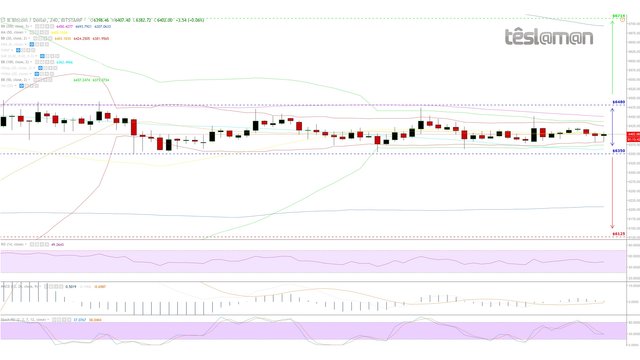
4H Chart - Price Key Points:
- 12 days in the development of a possible symmetrical triangle.
- Channels very narrow.
- 200MA resistance dropped at approx $6450.
- RSI and MACD stable.
- Stochastic RSI with a positive divergence.
- Volume has disappeared.

Possible Scenarios (unchanged):
Long: On a confirmed break above $6480 – Price Target $6714 | Probability: 40% | Signal Strength: 5/5
Neutral: Price Range $6350 - $6480
Short: On a confirmed break below $6350 – Price Target $6125 | Probability: 36% | Signal Strength: 3/5
Our Stance: Speculative long.