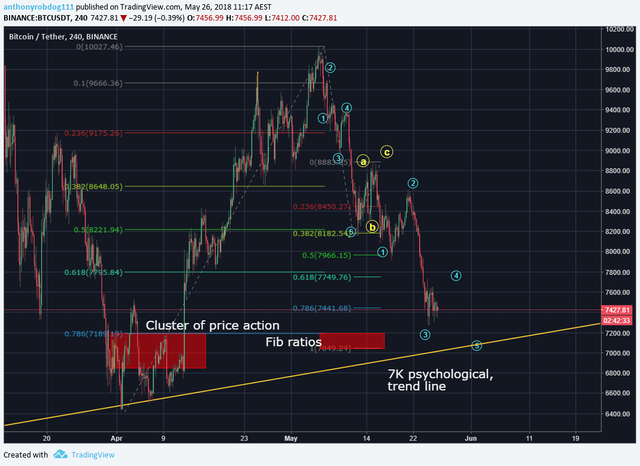
BTC: A lot if support for BUYERS
There are many confluent reasons to expect a trend reversal at this 7K region, most have been touched on before but now included is an elliot wave count I now consider viable. Take note that if this count is validated we will be entering the 3rd wave of an elliot wave cycle which could be very bullish. In previous post I have indicated profit taking regions at resistances and they remain the same.
There is a cluster in price action from 7.2K
Fib ratio extensions of the A wave of the retracement land at 7,049
Fib ratio retracements of the impulse wave land the 0.786 at 7.2K
There is a long term trend line above 7K
and the 7K number is a psychological resistance.
These are the reasons why I believe there will be a reversal at this price.
Set stop losses below 7K and if broken I will re-evaluate the situation then. although it is unlikely.

This chart is less technical analysis and more about Explaining the power of cluster supports visually.
As can be seen in chart 2: As we have tested each cluster support in the retracement the resistance has become increasingly difficult to break. In the first cluster support the sellers went right through it, the second one had less sellers and therefore price action stalled more there. Lastly, now that we have reached the third cluster support we already began to stall, these increases in resistance indicate that the bears are losing steam.

Hi, thank you for contributing to Steemit!
I upvoted and followed you; follow back and we can help each other succeed :)
P.S.: My Recent Post