15th July BTC Analysis
Bearish View
(more probable)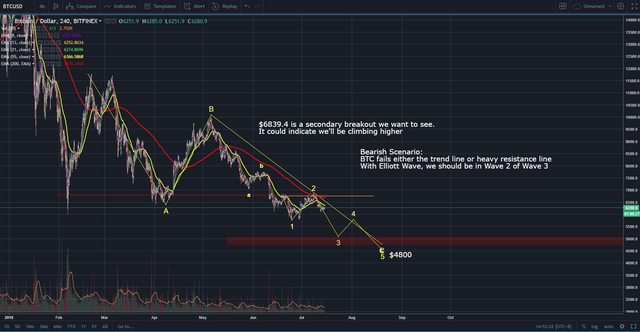
Analysis
Bearish Scenario:
BTC fails either the trend line or heavy resistance line
With Elliott Wave, we should be in Wave 2 of Wave 3
Bullish View
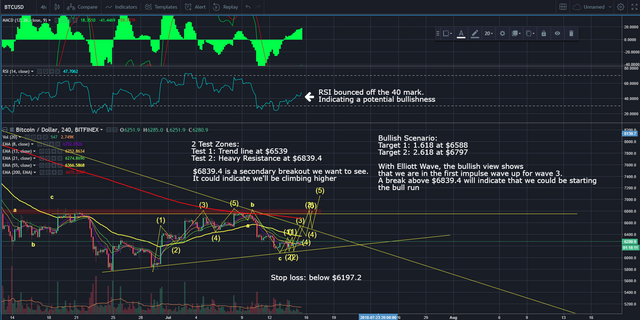
Analysis
Bullish Scenario:
Target 1: 1.618 at $6588
Target 2: 2.618 at $6797
With Elliott Wave, the bullish view shows
that we are in the first impulse wave up for wave 3.
A break above $6839.4 will indicate that we could be starting
the bull run
2 Test Zones:
Test 1: Trendline at $6539
Test 2: Heavy Resistance at $6839.4
$6839.4 is a secondary breakout we want to see.
It could indicate we'll be climbing higher
Stop loss: below $6197.2