Bitcoin Analysis Short/Mid/Longterm - 20.03.2018
This was clearly an amazing week for everyone active in the crypto space. I almost spent the last 4 days in front of my charts trading, where I witnessed a fairly critical moment for Bitcoin and also an amazing bounce. I'll now try to give you an outlook for the next few days, weeks and months.
The 4h Chart

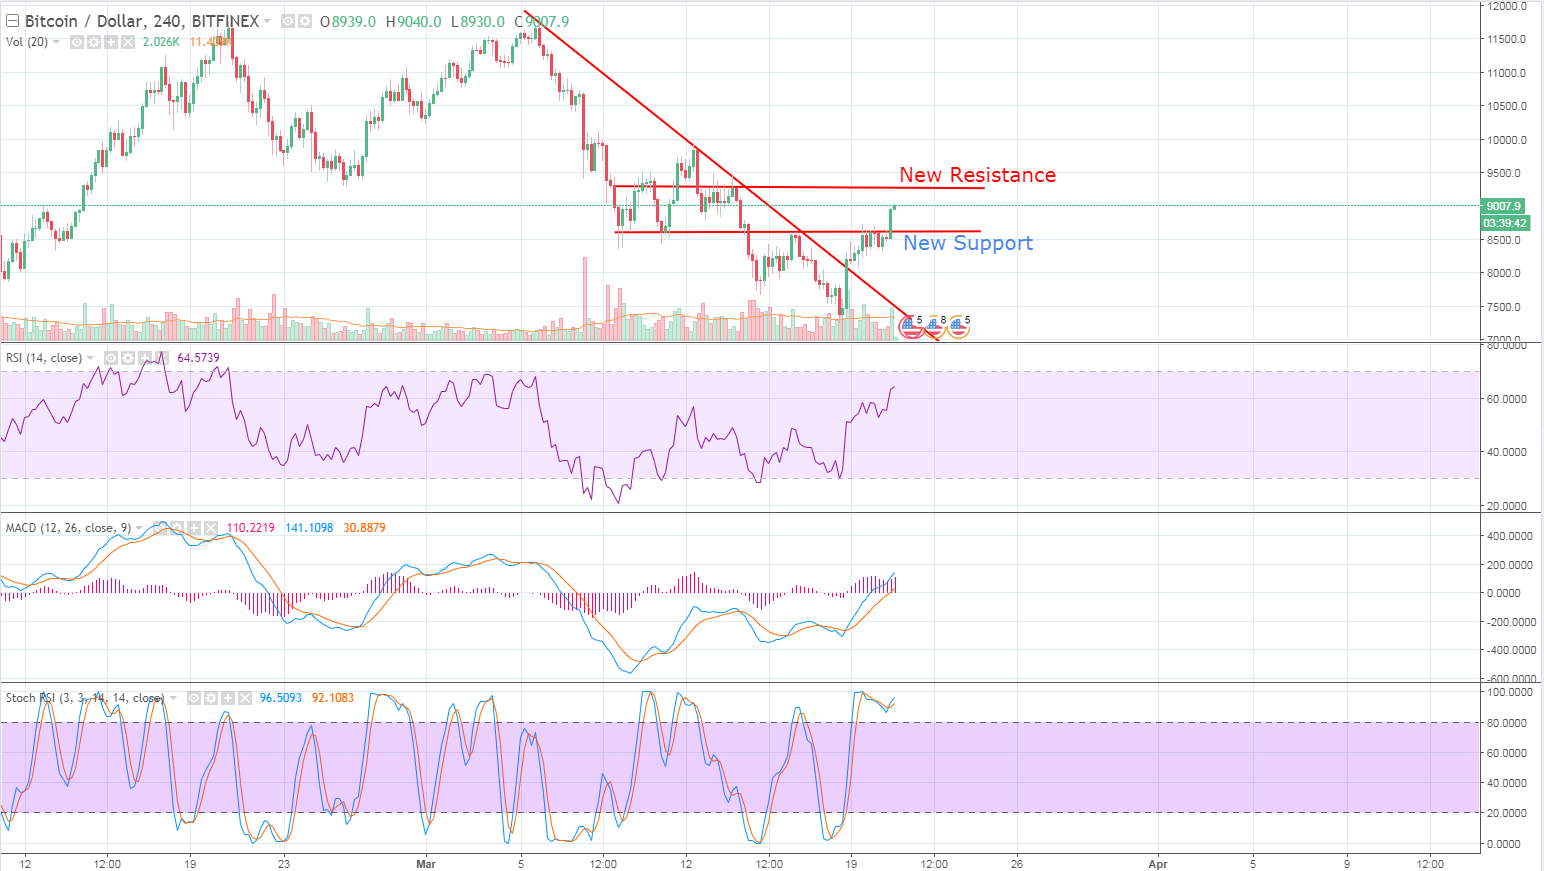
On the 4h chart we can clearly see that Bitcoin literally pumped itself through the 8600$ resistance like it was nothing. Many traders and analysts expected a medium sized correction to the 7800-8200$ area, which did apparently not happen. The old resistance line is now our new key support region, while the 9100-9300$ area will act as a strong resistance. The MACD indicator aswell as the Stochastic RSI show that Bitcoin is slowly losing steam, although it would have enough power left for one last pump. One can not clearly say that the price is going into a medium sized correction or will move up to the new resistance zone.
The Daily Chart

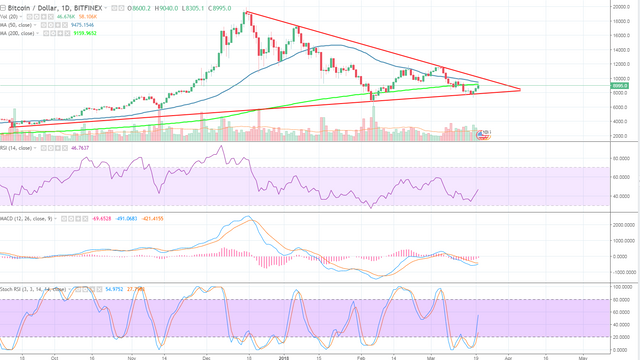
The Daily Chart, which is definitely my favorite, shows us a three white soldiers pattern, implicating a very bullish momentum. A penetration through the next resistance level could yield a rally to the 9600$ area, which is also the descending trendline. While the indicators show that there is a huge amount of steam left for a further uptrend, we are still in a very critical situation.
First, there is the so called death cross: The 200 Day Moving Average is right before crossing the 50 Day Moving Average, which could be an impactful bearish sign. What most people don't know, the perfect moment for a short position is right when the price is inside of the death cross. But this does not mean that you should enter a short position. One argument against this event is that the momentum is extremely bullish at the moment. Another point is that one can not always trust moving averages, as they are time lagging indicators. Often have we seen a death cross without any impact at all.
What should also make ourself sceptical, is the volume of the current bounce. If you compare the trading volume of the 6th of February low with the current volume, you will see a noticeable difference. Of course, volume can always come back at any time as a consequence for good news.
Nevertheless, if we fail to break through the descending trendline resistance, a drop to 6000$ is almost inevitable.
The Weekly Chart

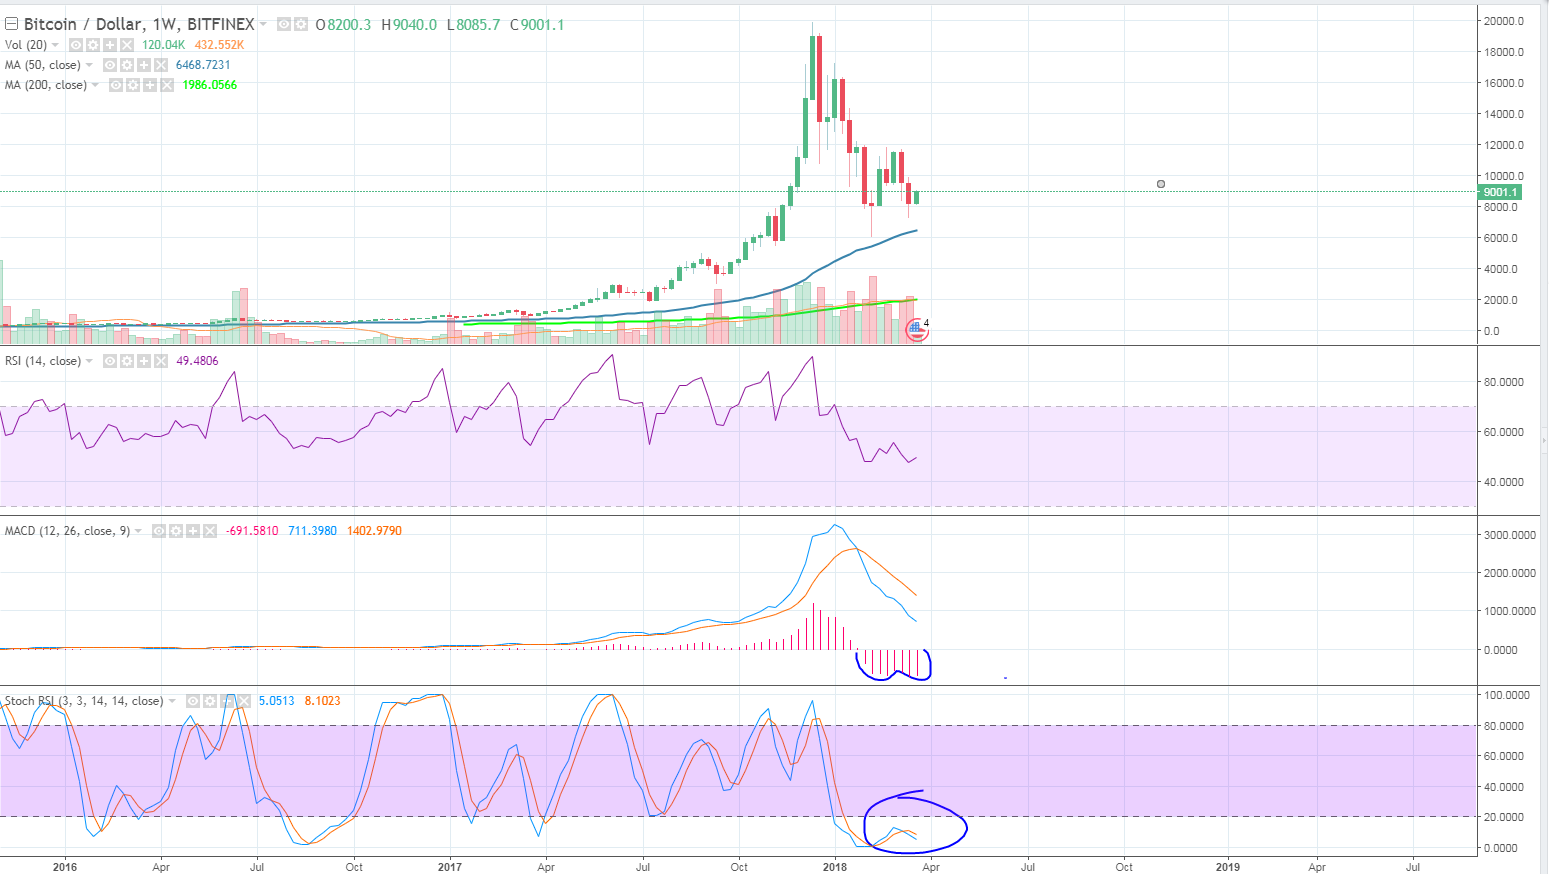
While the weekly chart indicators imply a possible bullish scenario for the next week, the candle sticks show us a neutral-bearish formation. We must admit that we are still in a downtrend. The current weekly candle is looking nice so far, but it is still a lot time left until it closes. To be certain that the downtrend is finally broken we need to wait at least until the end of the next week (need to break the 11800$ resistance).
The week is going to be very interesting. Bitcoin has a new chance to finally abandon the bears. But if he can not break the downtrend, the bearish situation would probably continue until the mid of April.
Disclaimer: This is not investment advice, I am not a licensed financial advisor. I am not responsible for any trades or investments you make due to the informations of this article.