BTC/USD - Descending Triangle of Juiciness 31/5/18
Suh my guys
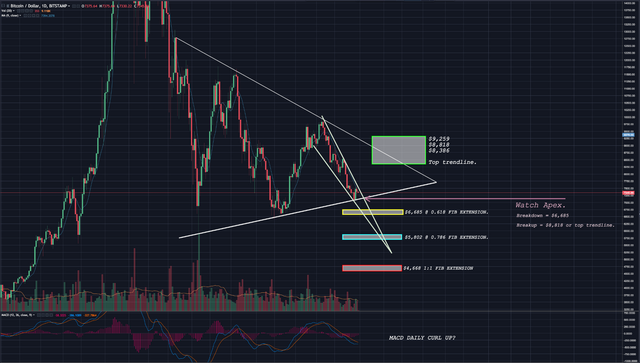
#BTC following the triangle nicely, respecting the top trend with a minor rejection.
This has pushed price towards an apex between :
Larger Symmetrical Triangle Support
&
Decsending Triangle Resistance
One way or another price has gotta pop!
A break DOWN below the Symmetrical Triangle Support will lead to an initial test of $6,686.
A break UP over the Descending Triangle Resistance will lead to a test of the upper trend line.
The trendline test could occur between $9,259 & $8,386.
However $8,818 seems to be a nice fib target, matching the trendlines average.
The DAILY MACD also seems to be curling upwards, keep an eye on those lines crossing up cause that could mean kaboom!
Keep an eye on the indicators located on my chart below, enjoy!

Legal Disclaimer: I am only as good as guesses and fibonacci , i love to share my information however i am not telling anybody to specifically follow in any of the trades or decisions i make. I win , I lose but at the end of the day i use this all as a platform to share my opinions on possible outcomes and trades i will be completing. Happy Trading!