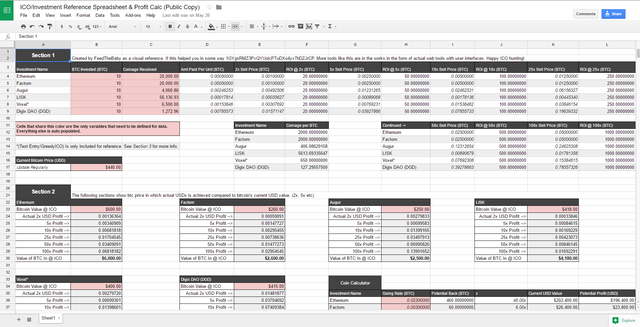
Cryptocurrency and Bitcoin Related Spread Sheet for ICO Investing & Reference
The following sheets provide a reference of price, cost, market cap for cryptocurrency ICO's. Before, during and after.
These sheets autopopulate (built in formulas) after input minimal information and the result is a general breakdown of numbers associated. I will update this post as more sheets are made.
Sheets can be useful as just one of many tools to judge an ICO, Token Crowdsales etc.

Sheet 1 (ICO Sheet + DAO (WORK IN PROGRESS))
https://docs.google.com/spreadsheets/d/1JRQTlyBFti_GkOsuPK_psp2UKcnWMC7xGdT9o3Dr5zU/pubhtml
Sheet 2 (ICO/Investment Reference Spreadsheet & Profit Calc (Public Copy)) Sheet without DAO info
https://docs.google.com/spreadsheets/d/1Xp3xCKXjyB8x4-nR03A2_dU-Qx44-6FnMCXAf9fVYJI/pubhtml
Sheet 3 (ICO Reference Spreadsheet (Plutons))
https://docs.google.com/spreadsheets/d/1tRxbQWunwmHlJMy_KVHtmFYU-7yzQREFaHuAUGTzVWA/pubhtml
| Section | Description |
|---|---|
| 1 | Shows price per ico token, what the btc price would be at 2x/5x etc. |
| 2 | Shows btc price in which actual USDx is achieved compared to bitcoin's current USD value. (2x, 5x etc). |
| 3 | Shows required market cap needed in order to obtain the associated "x" amount. If BTC drops in value the market cap required to "x btc" will also fall. |
| 4 | Shows original usd paid per unit & the usd per unit currently required in order to obtain the associated "x" amount. End result is expected to be "This is the current usd price required to 'x' original USD/BTC invested." |
test
test
test
Hey man is there anyway to still access this spreadsheet?